Product updates
What's new in edge.
Each feature we release, explained: what it is, how to use it and what to know before you start.
Research
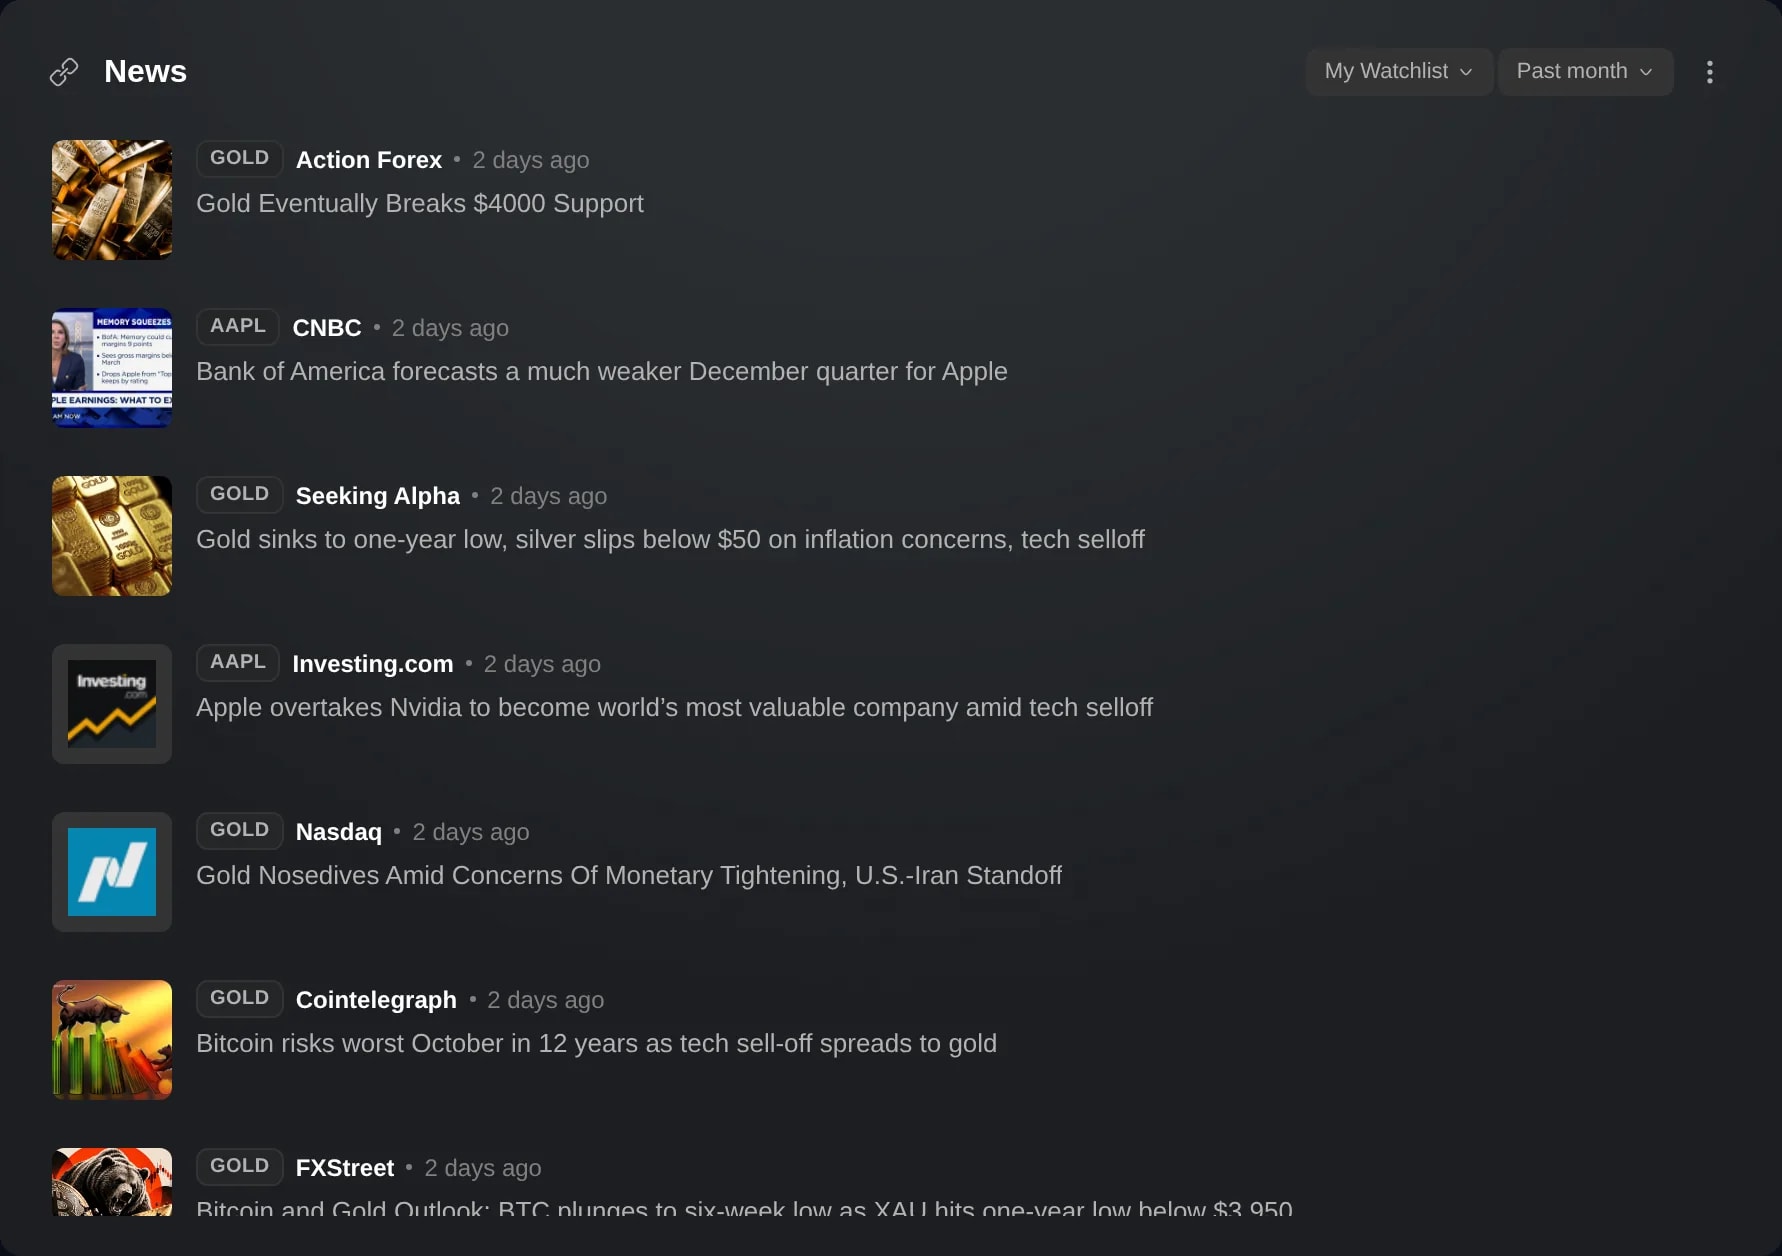
News headlines for your watchlists
Set a News widget to Unlinked and pick a list in its header, such as My Portfolio or a watchlist, to read the newest headlines across the whole list in one feed.
Read more
November 2026
October 2026
Charts
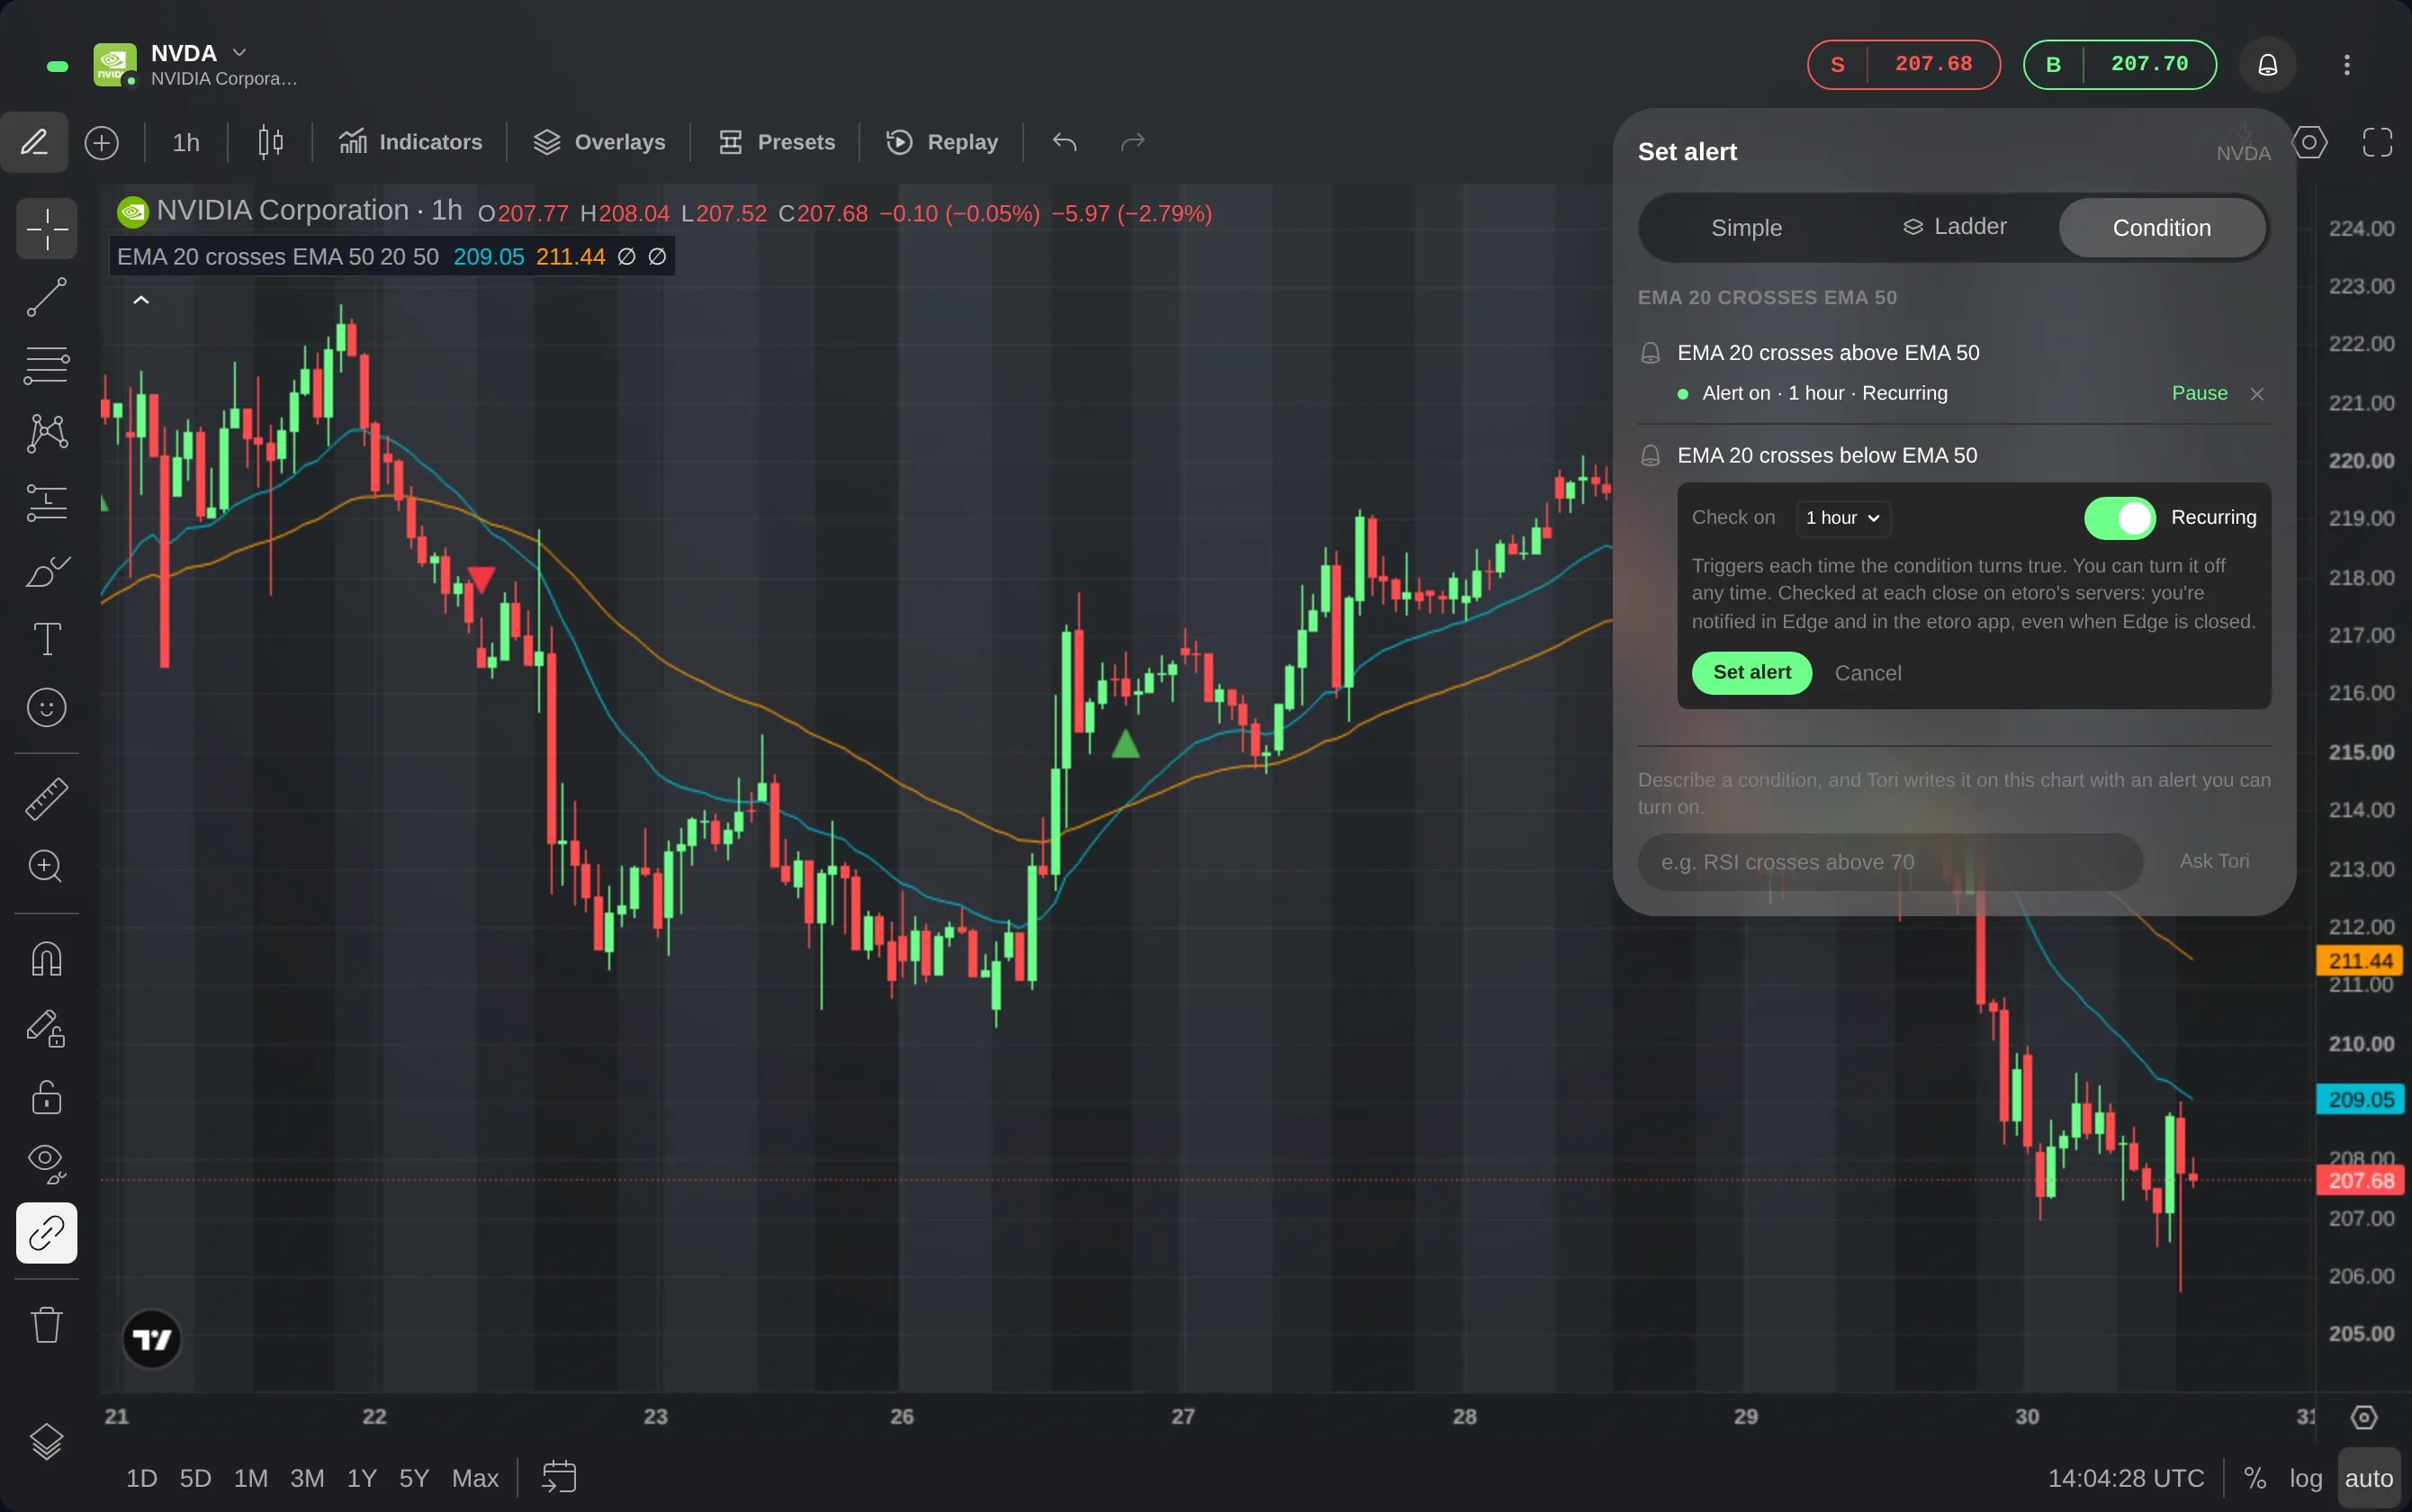
Alerts on script conditions
Ask Tori to tell you when something happens on a chart, such as RSI crossing above 70. etoro checks the condition at every bar close and notifies you, even with Edge closed.
Charts
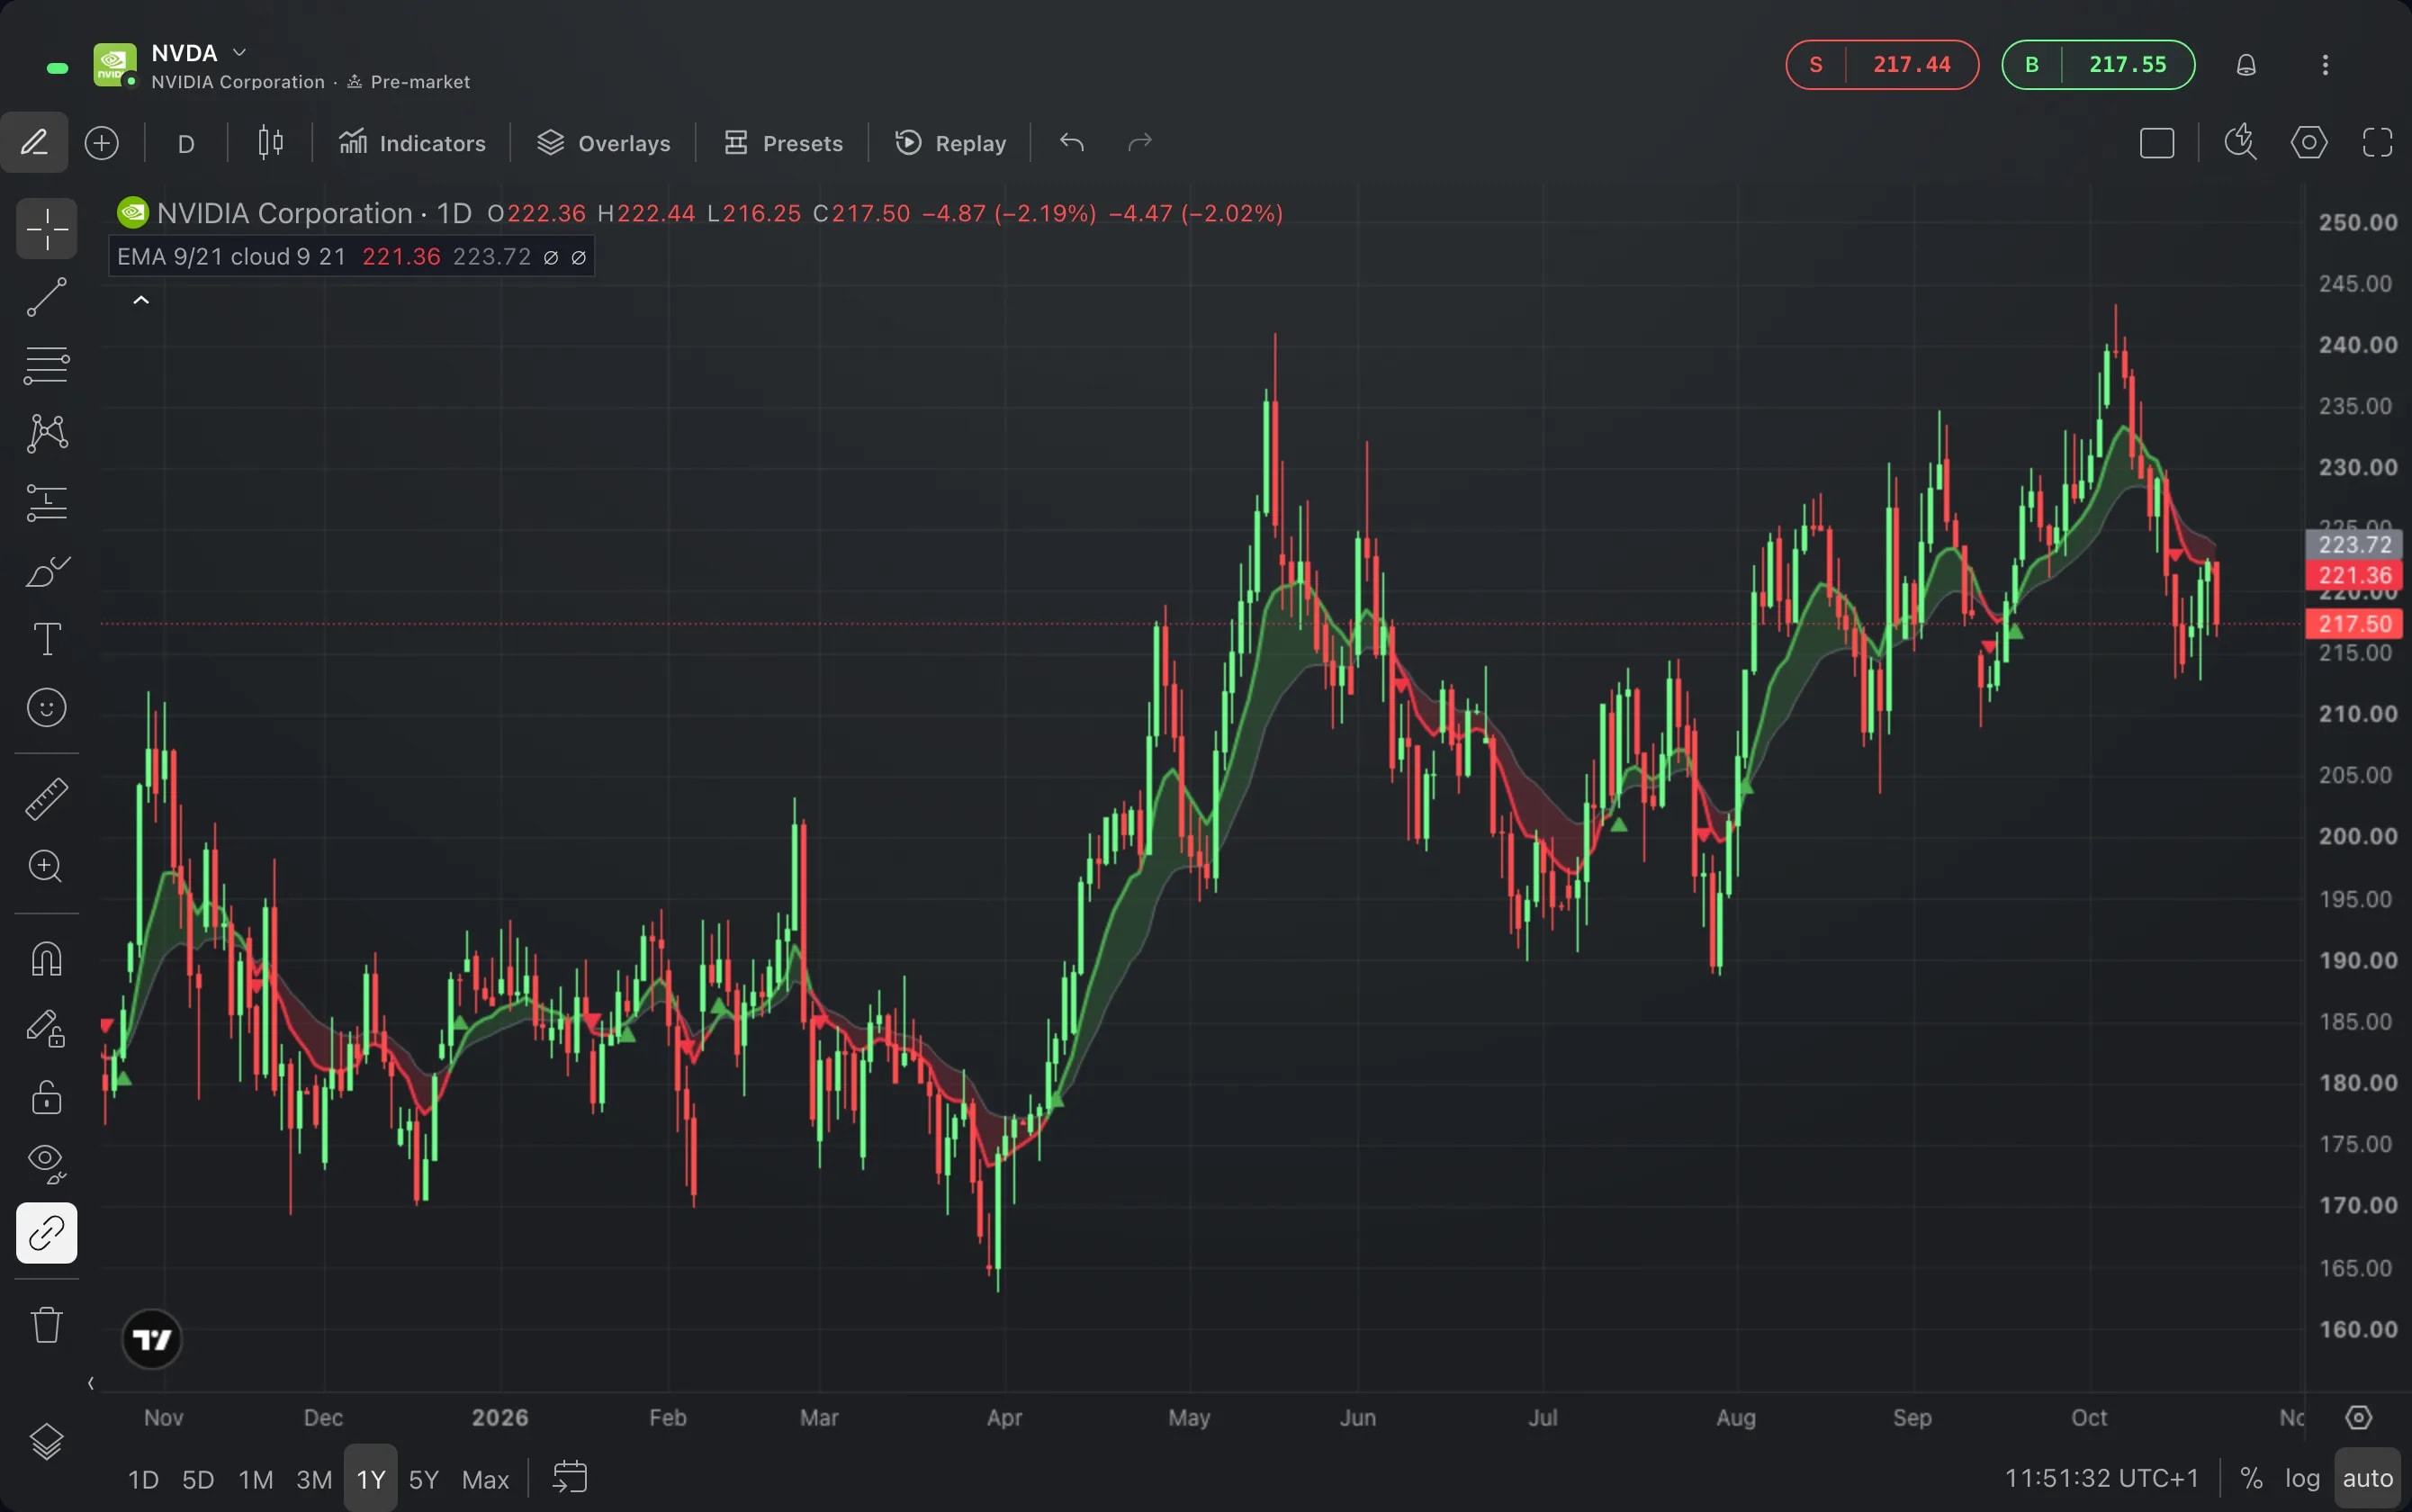
Scripts: indicators Tori writes for you
Describe the indicator you want in your own words. Tori writes it as a script, puts it on your chart and tells you what it found there.
Tori
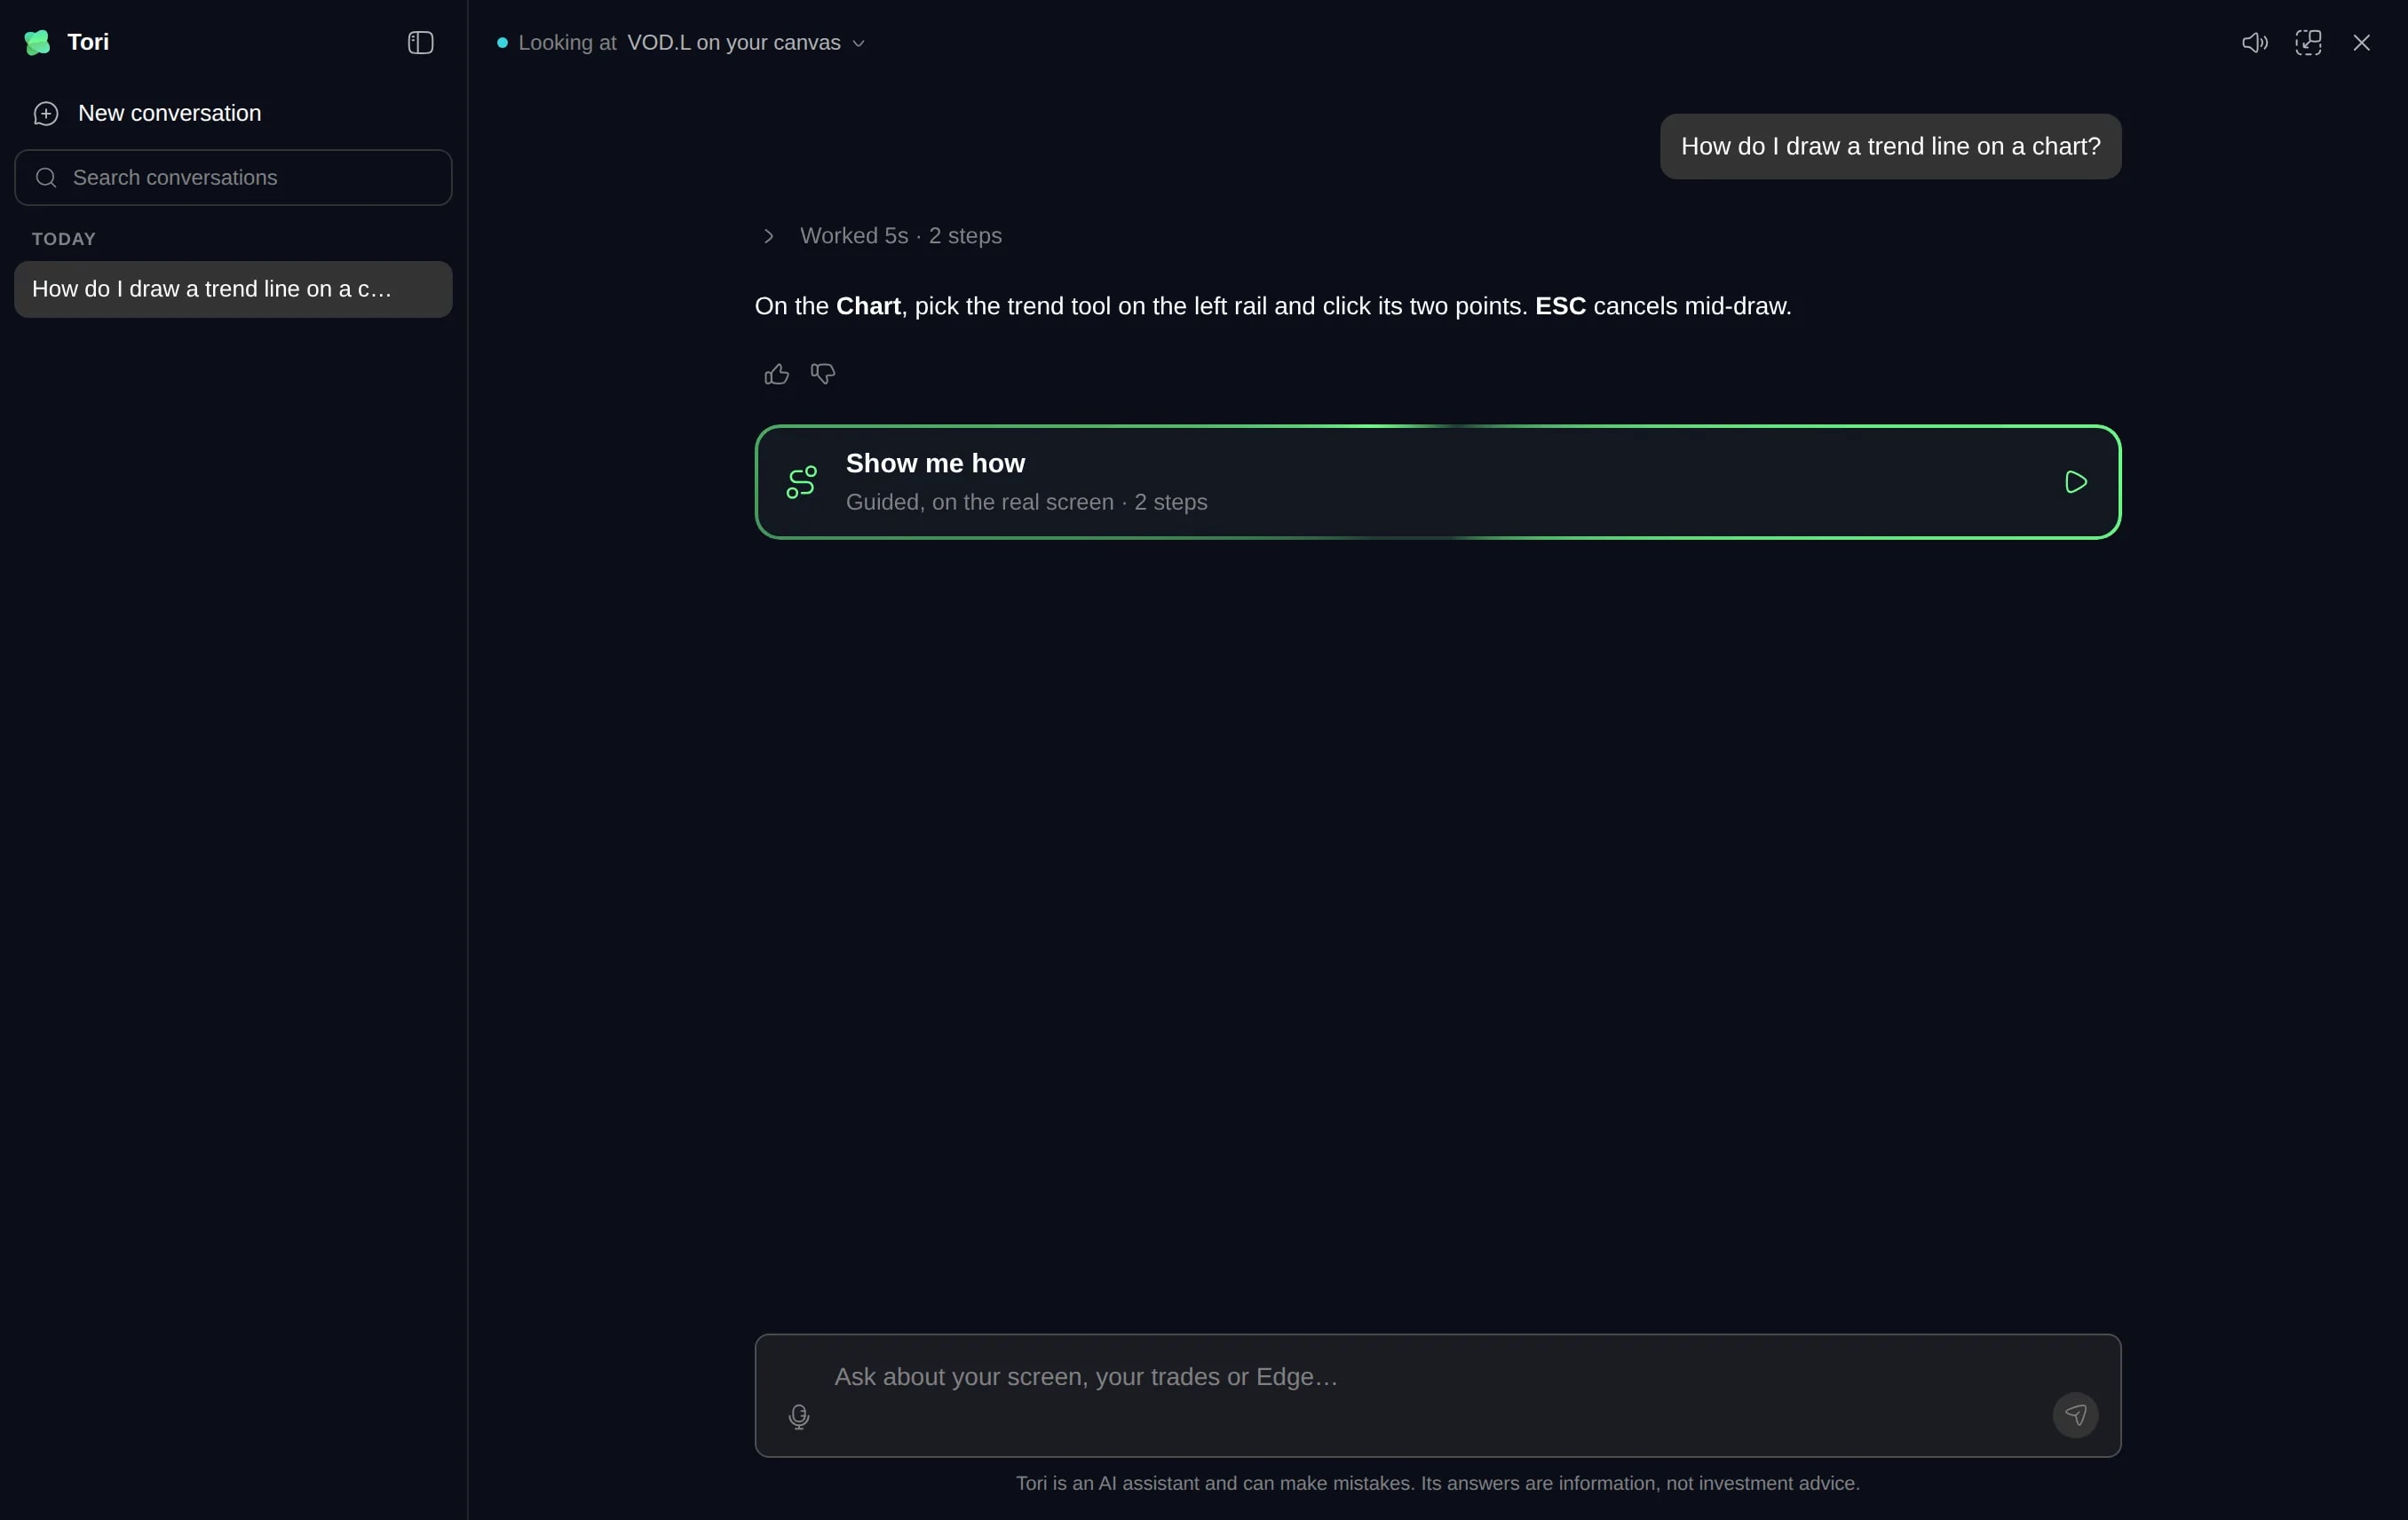
Expand Tori across the canvas
Tori can now fill the canvas area, with your conversations listed beside it to search, pin, rename and delete. Your layout waits underneath until Tori docks again.
Trading
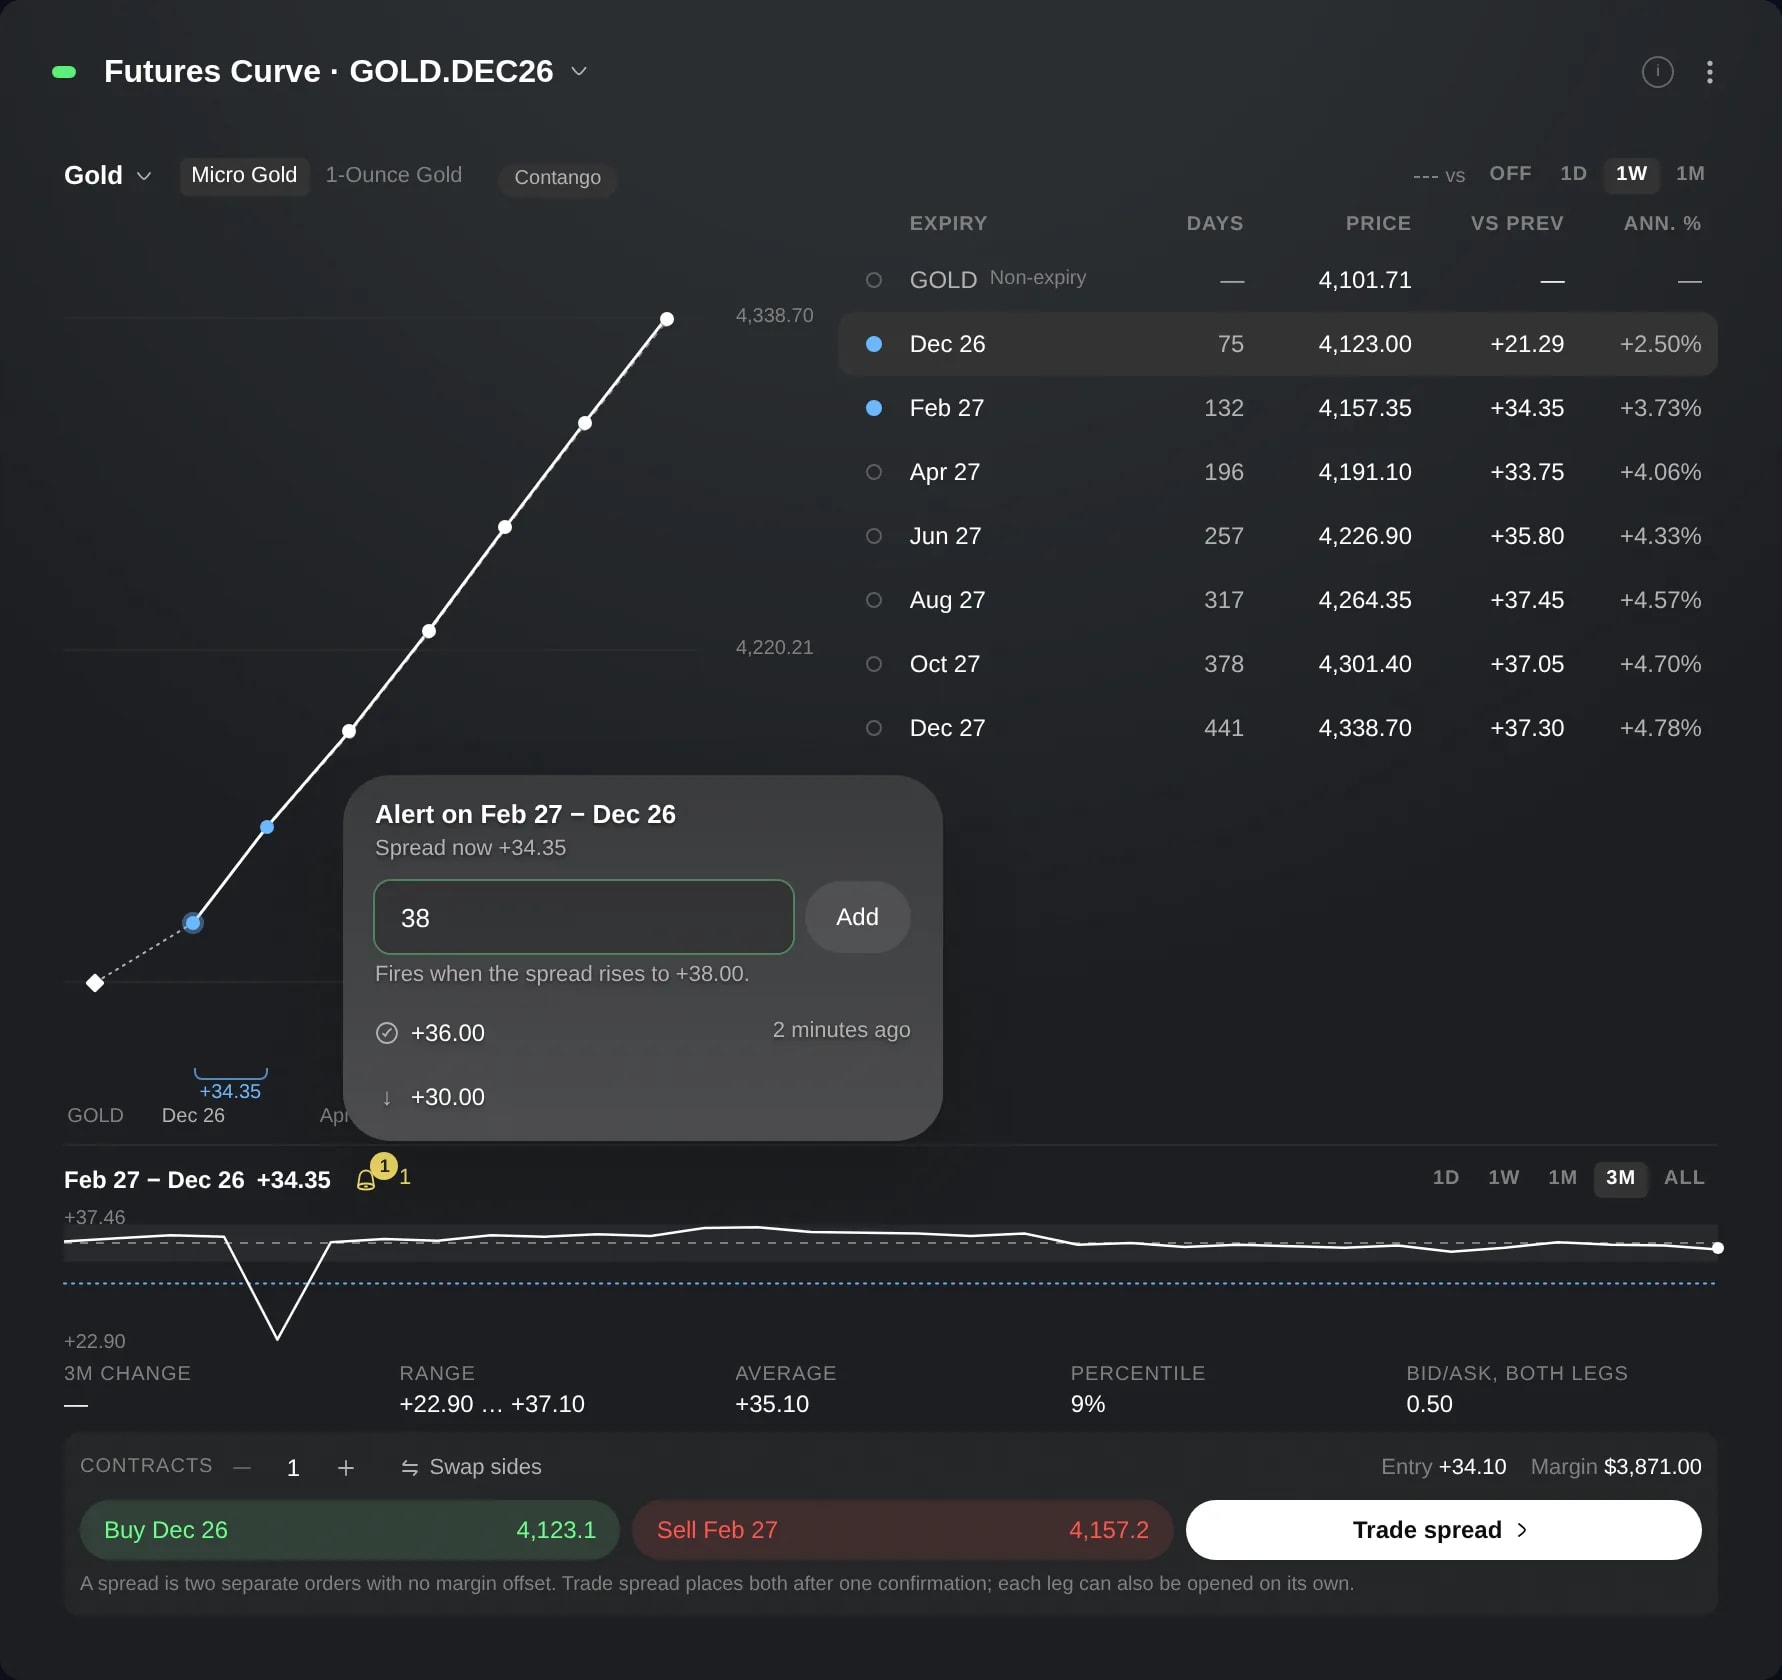
Futures spread alerts
Set a level on the spread between two futures contracts in the Futures Curve, and know when the spread reaches it.
Tori
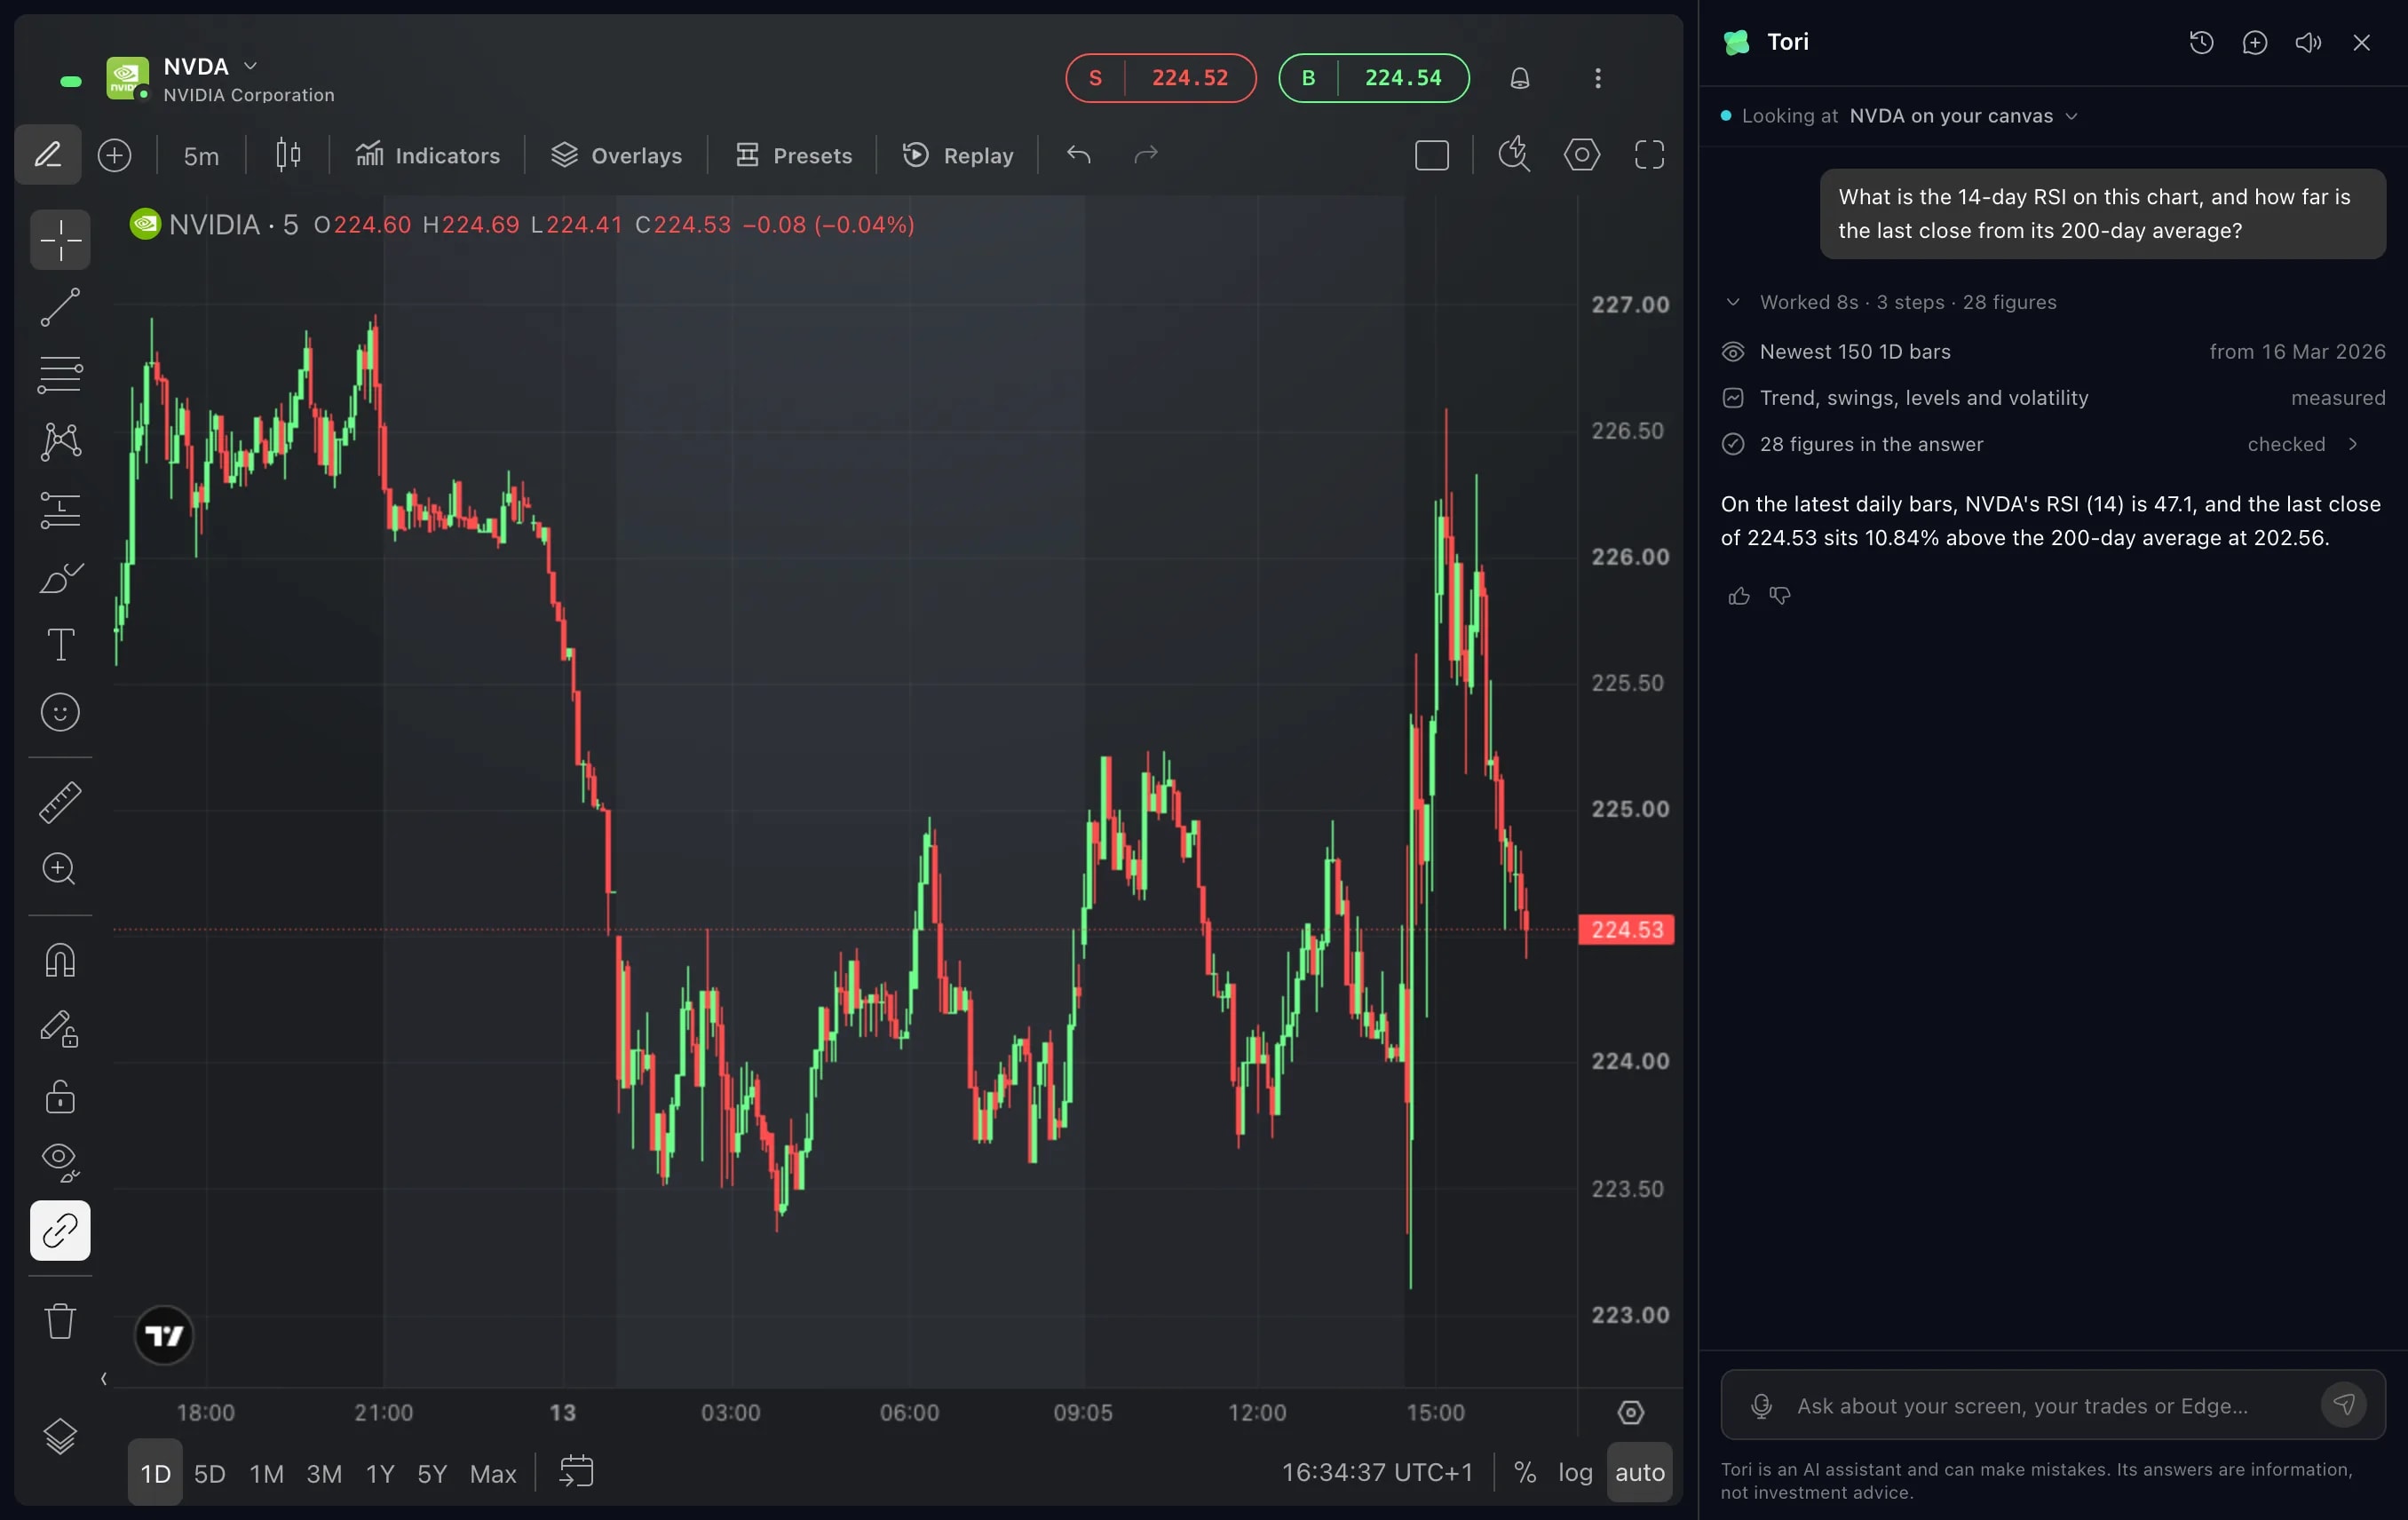
See what Tori did
Tori's answers now start with a line that says how long the answer took and in how many steps. Open it to see what Tori read, what it measured and what it changed.
Trading
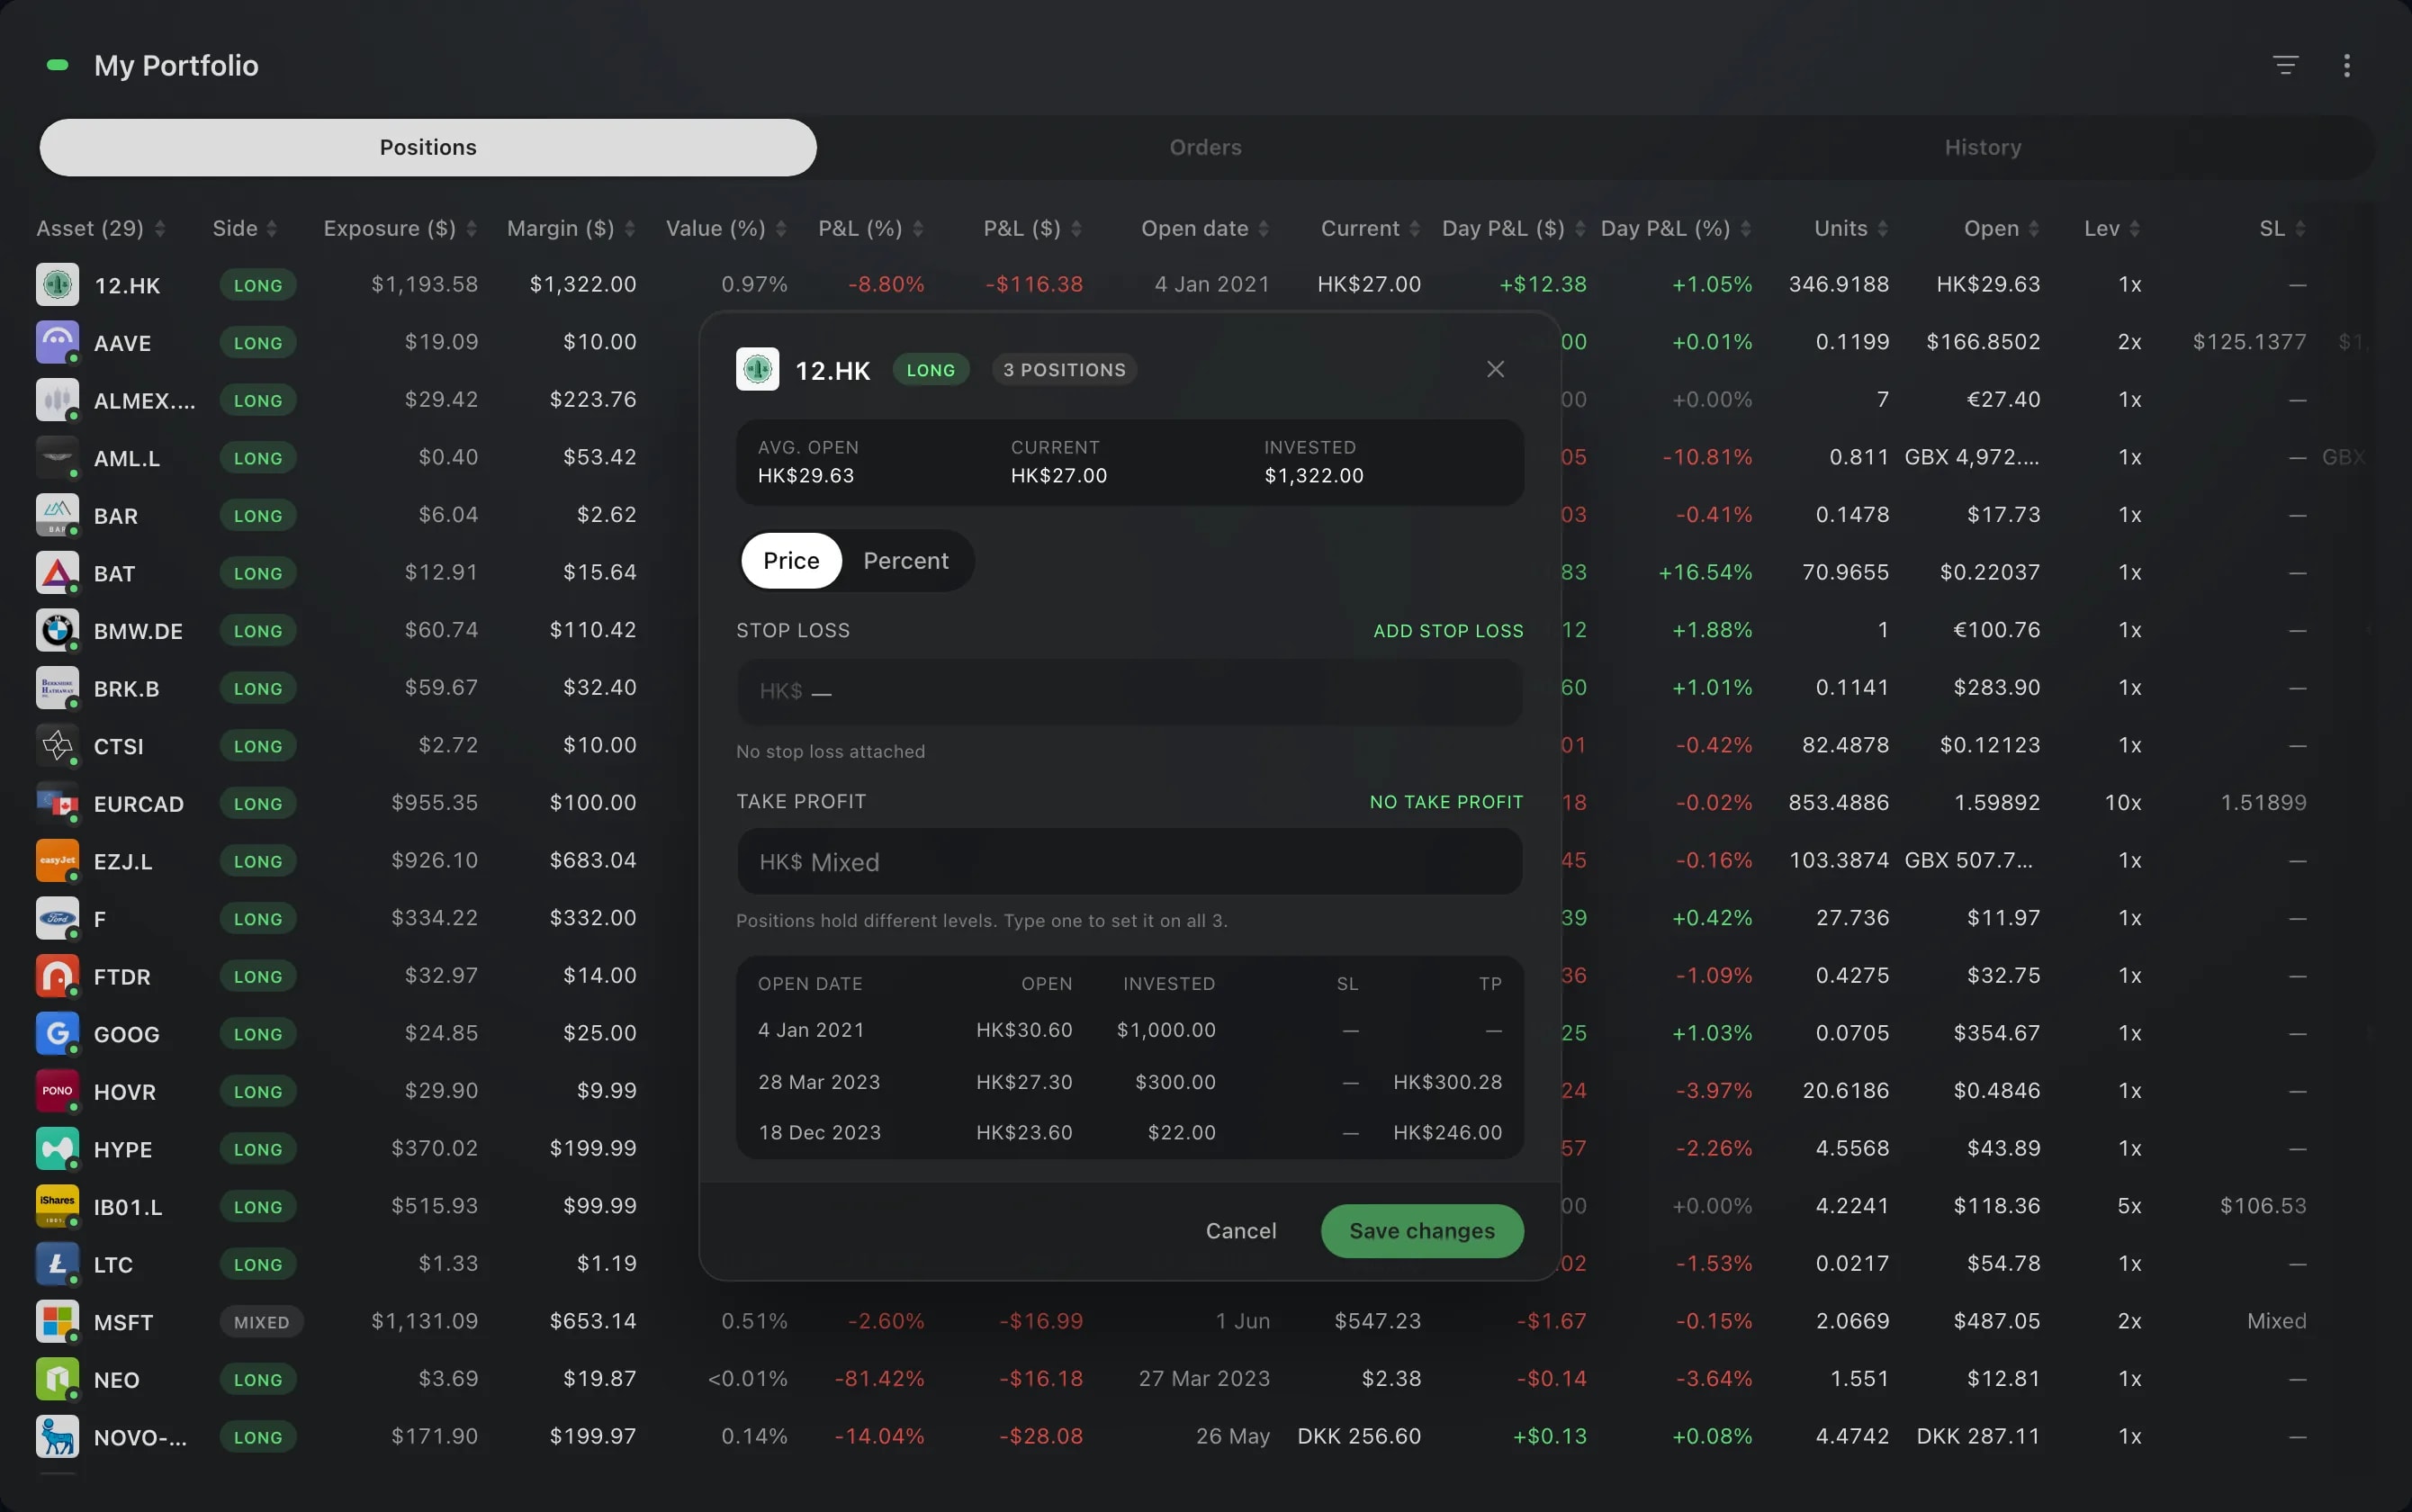
One stop loss for a whole holding
Hold several positions in one asset? Set their stop loss and take profit together in My Portfolio, in one editor.
Charts
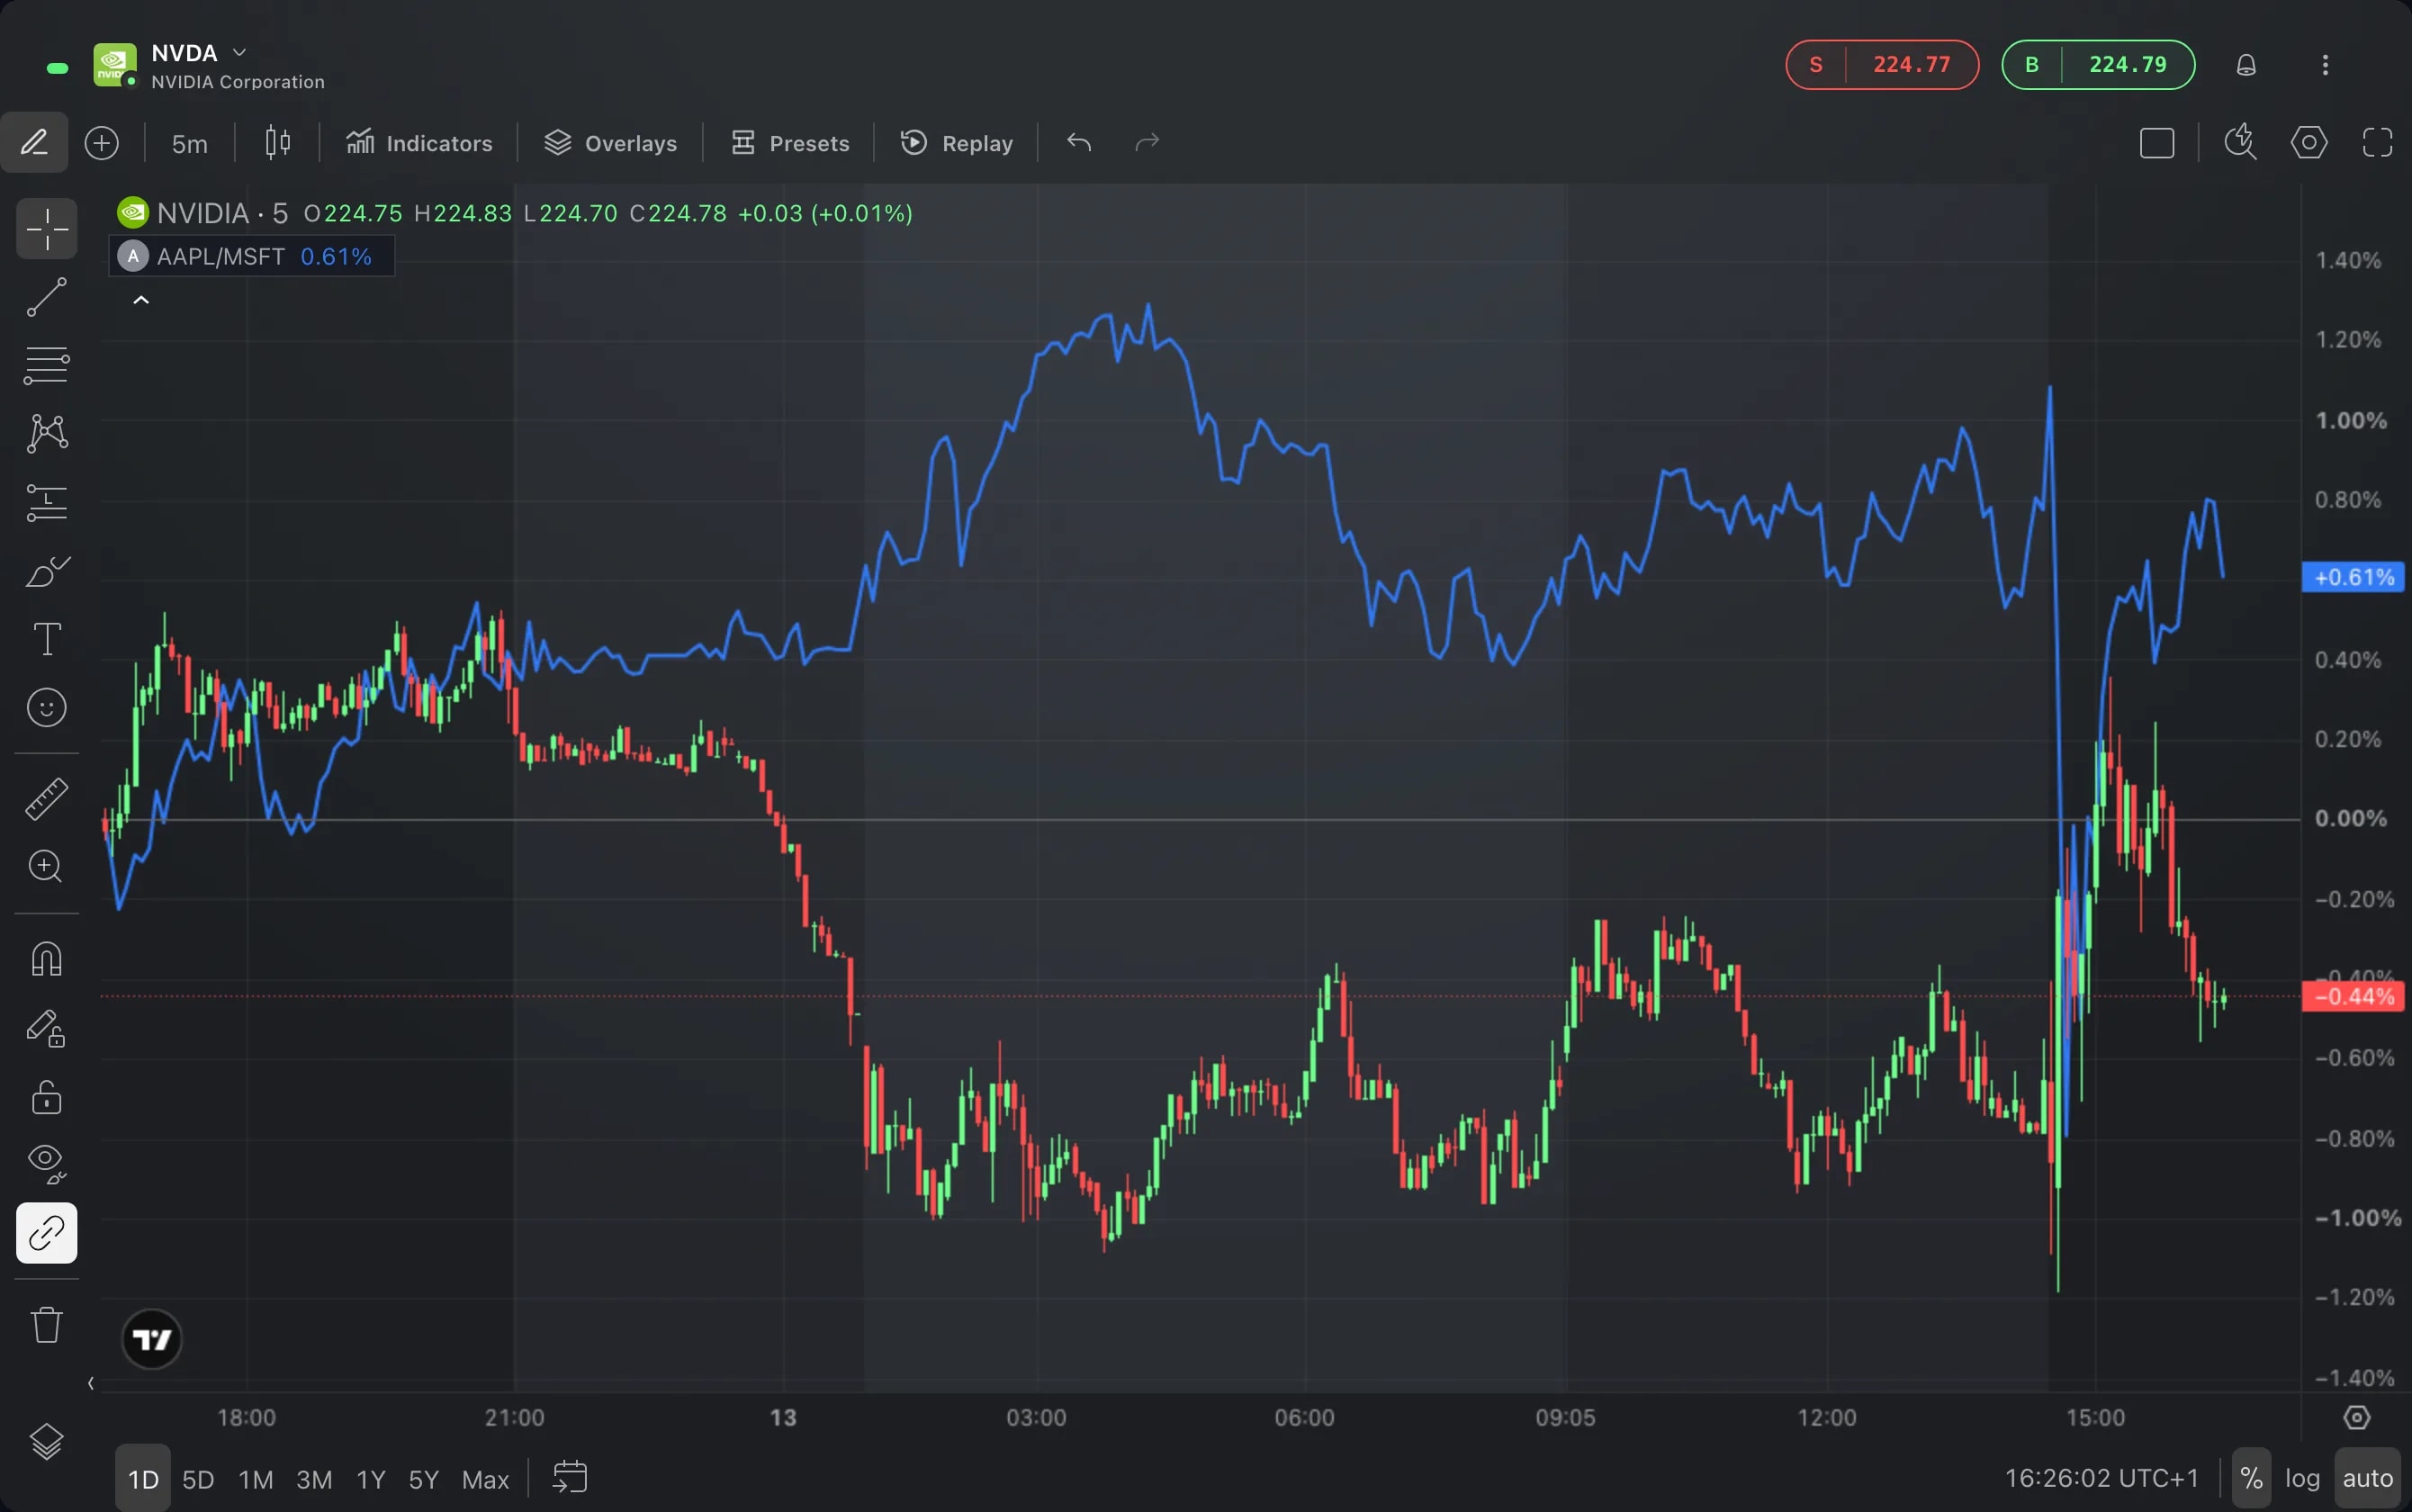
Custom intervals and spread charts
The chart's interval menu has more choices and takes an interval of your own, and Compare charts an expression such as AAPL/MSFT as one line.
App
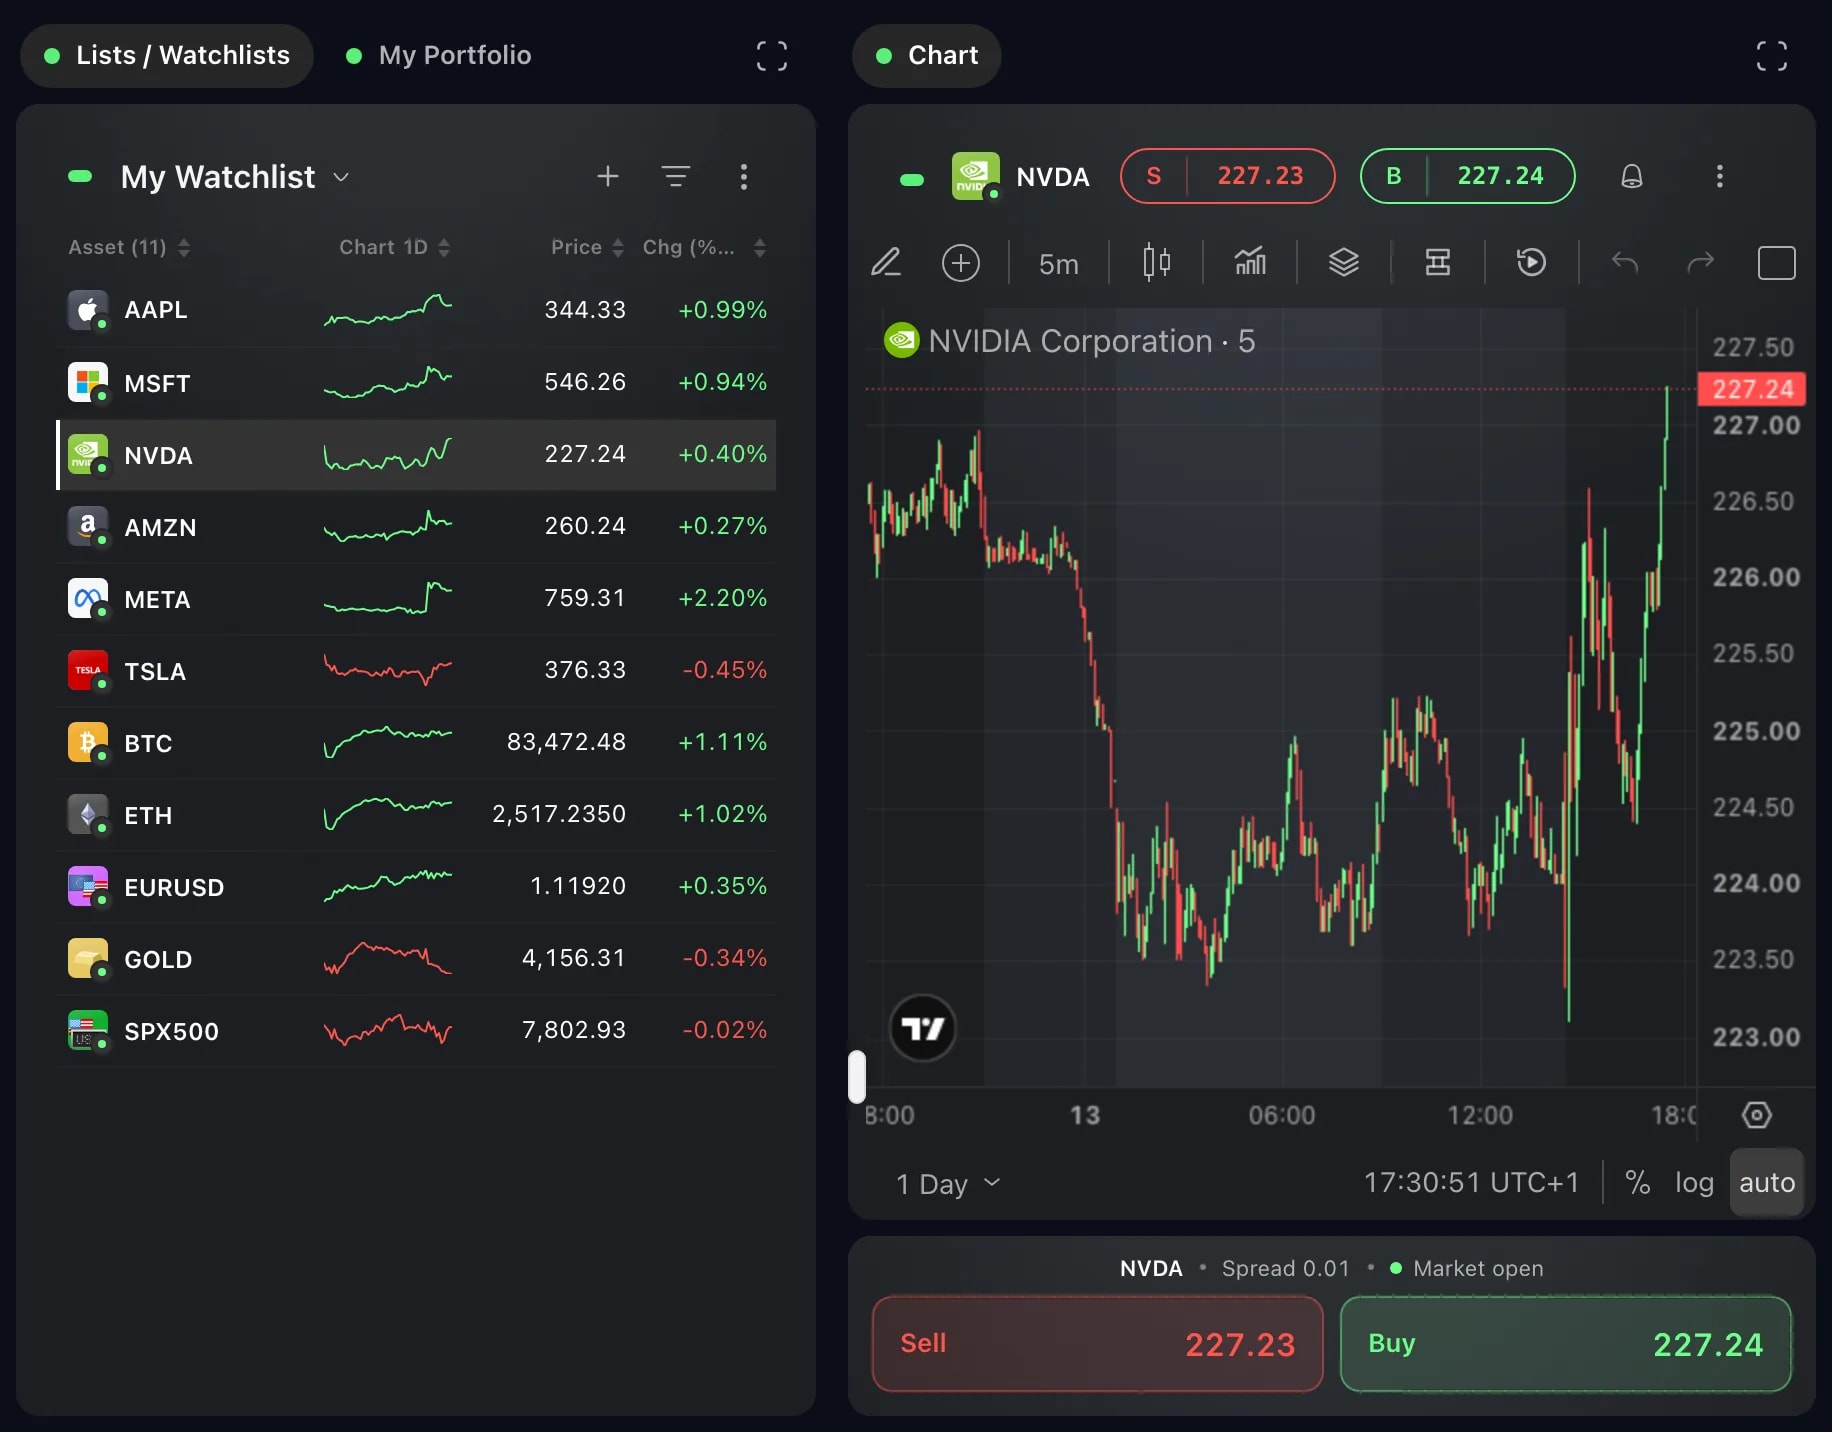
Edge on foldables and tablets
On an unfolded foldable, an upright tablet or a narrow window, your layout opens as two pages: your lists on one, and what you pick from them, with Sell and Buy, on the other.
Layouts
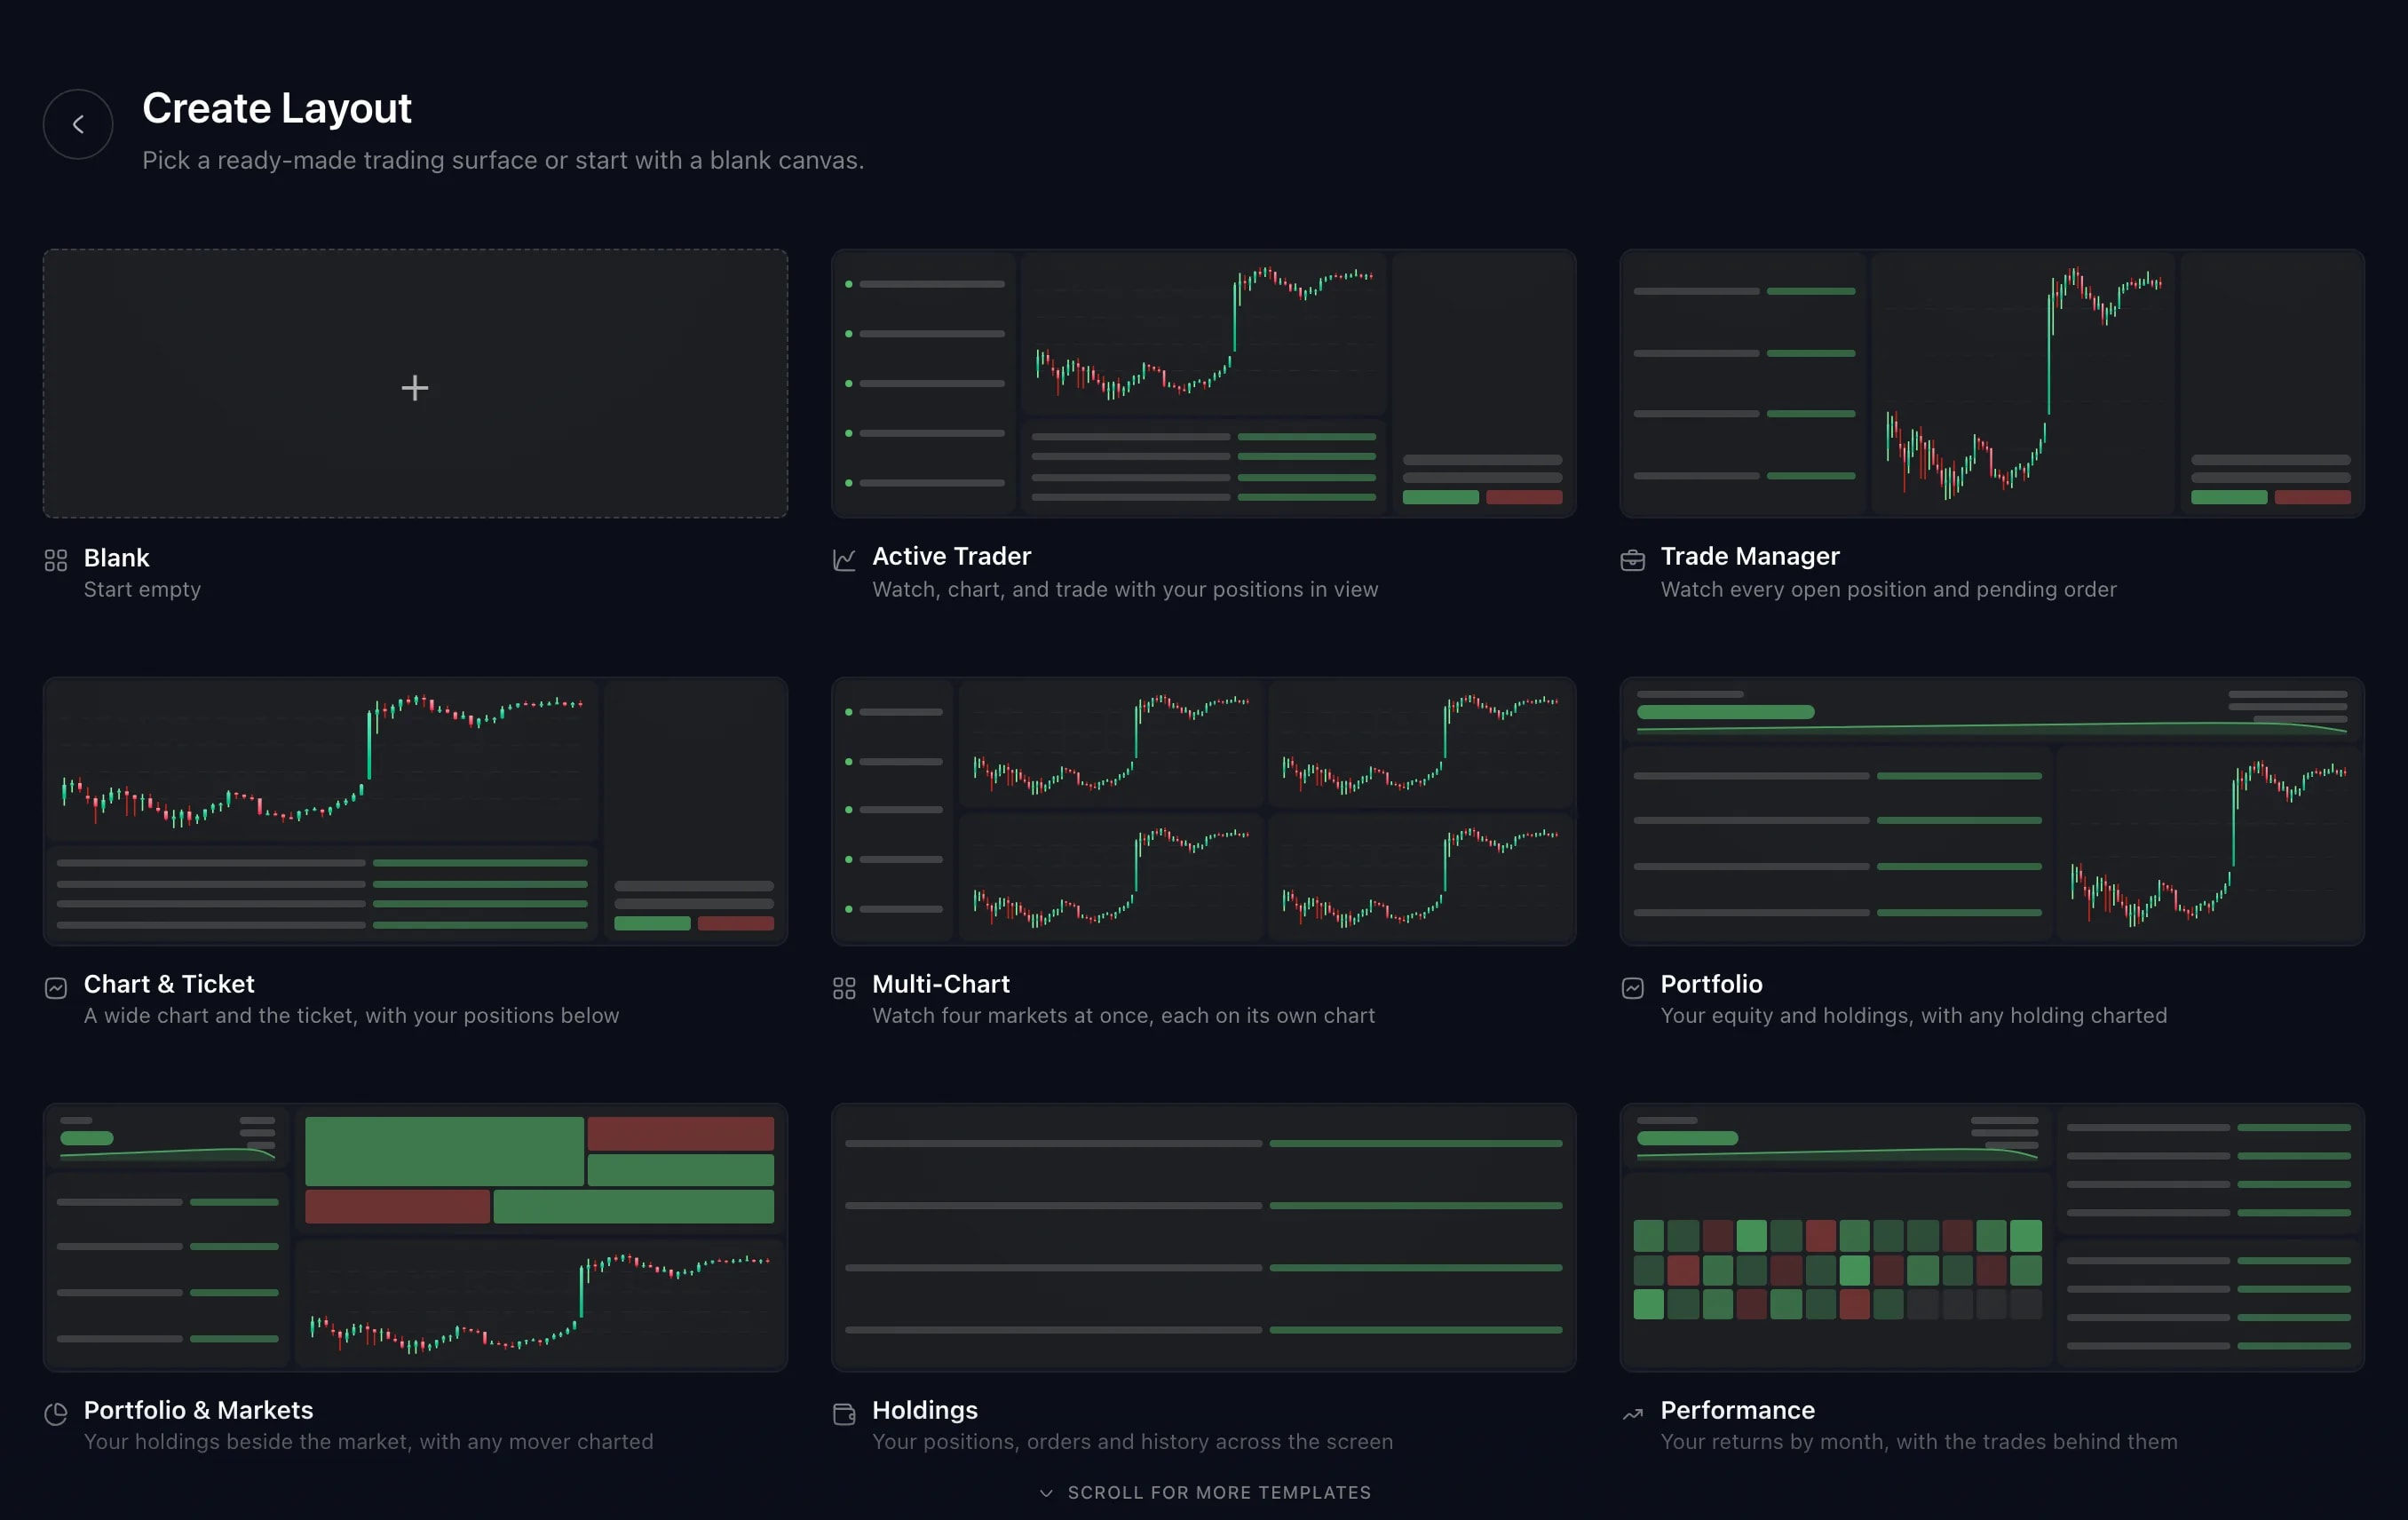
New ready-made layouts
Create Layout has more ready-made layouts, each arranged and linked for one job, from scanning the market to reading one market on two timeframes.
Trading
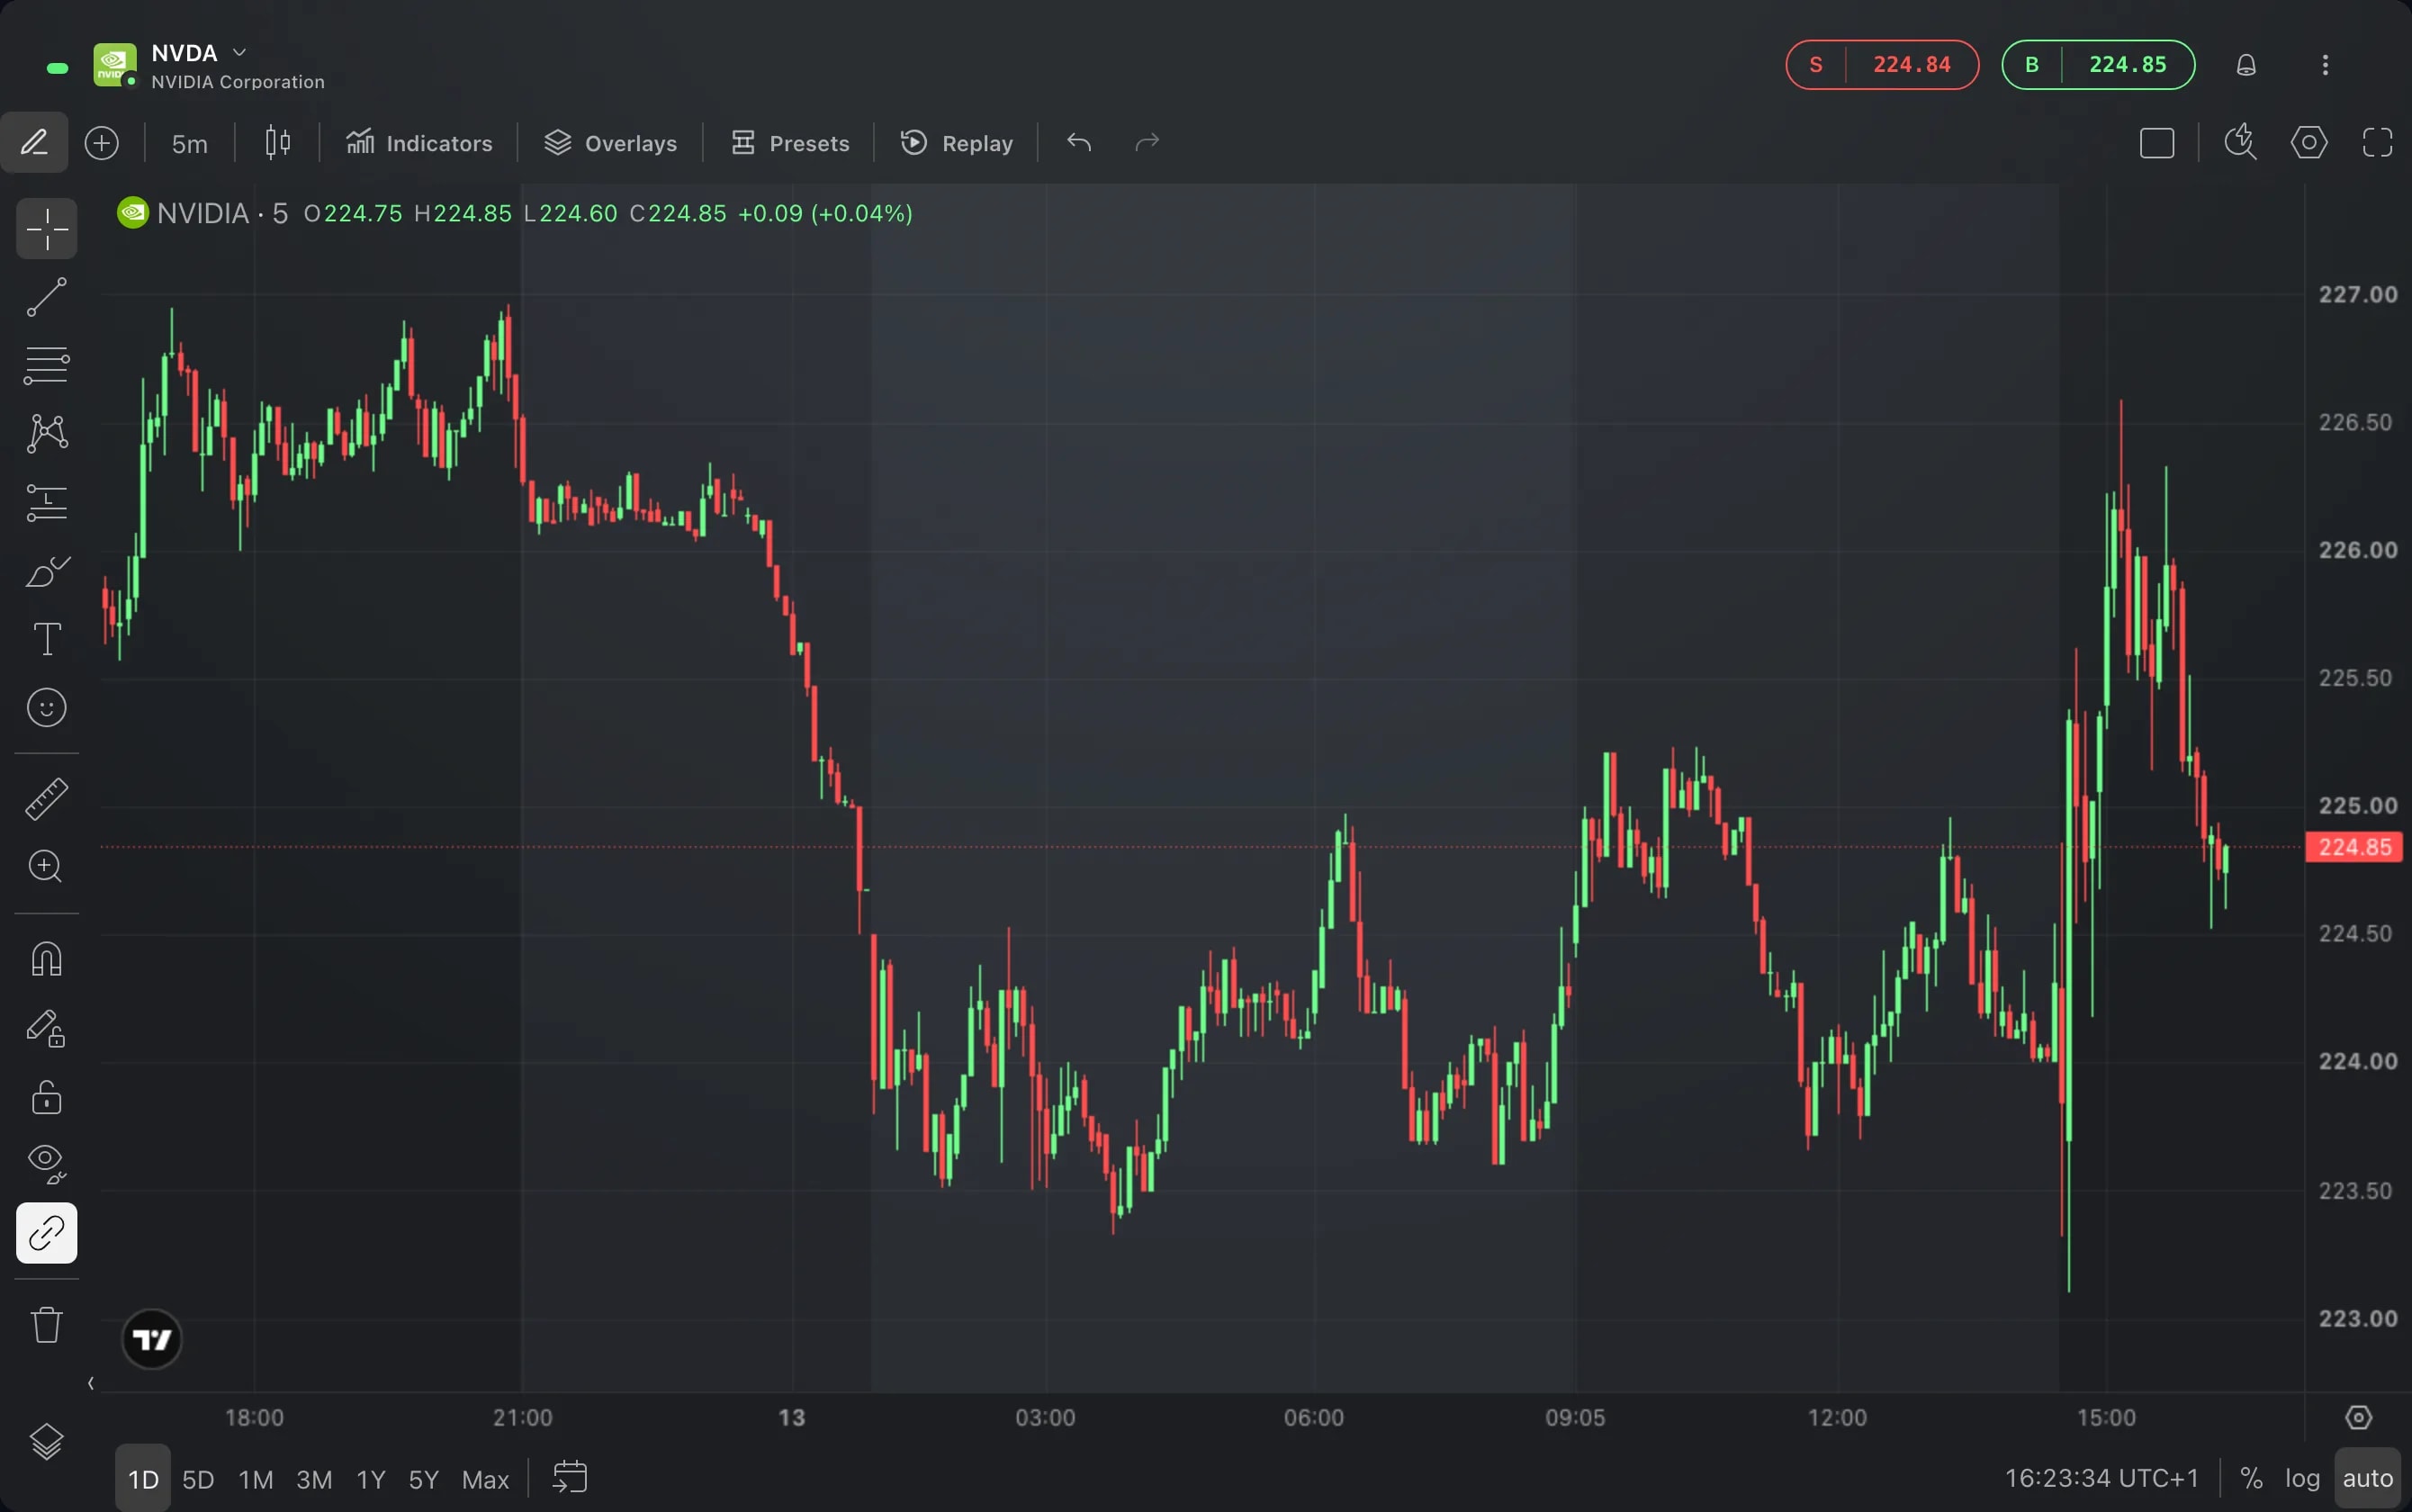
Pre-market, after hours and overnight
Outside regular hours, Edge names the session a US stock is trading in: pre-market, after hours or overnight. See it in the Order Ticket, on the chart and in Market Hours.
Portfolio
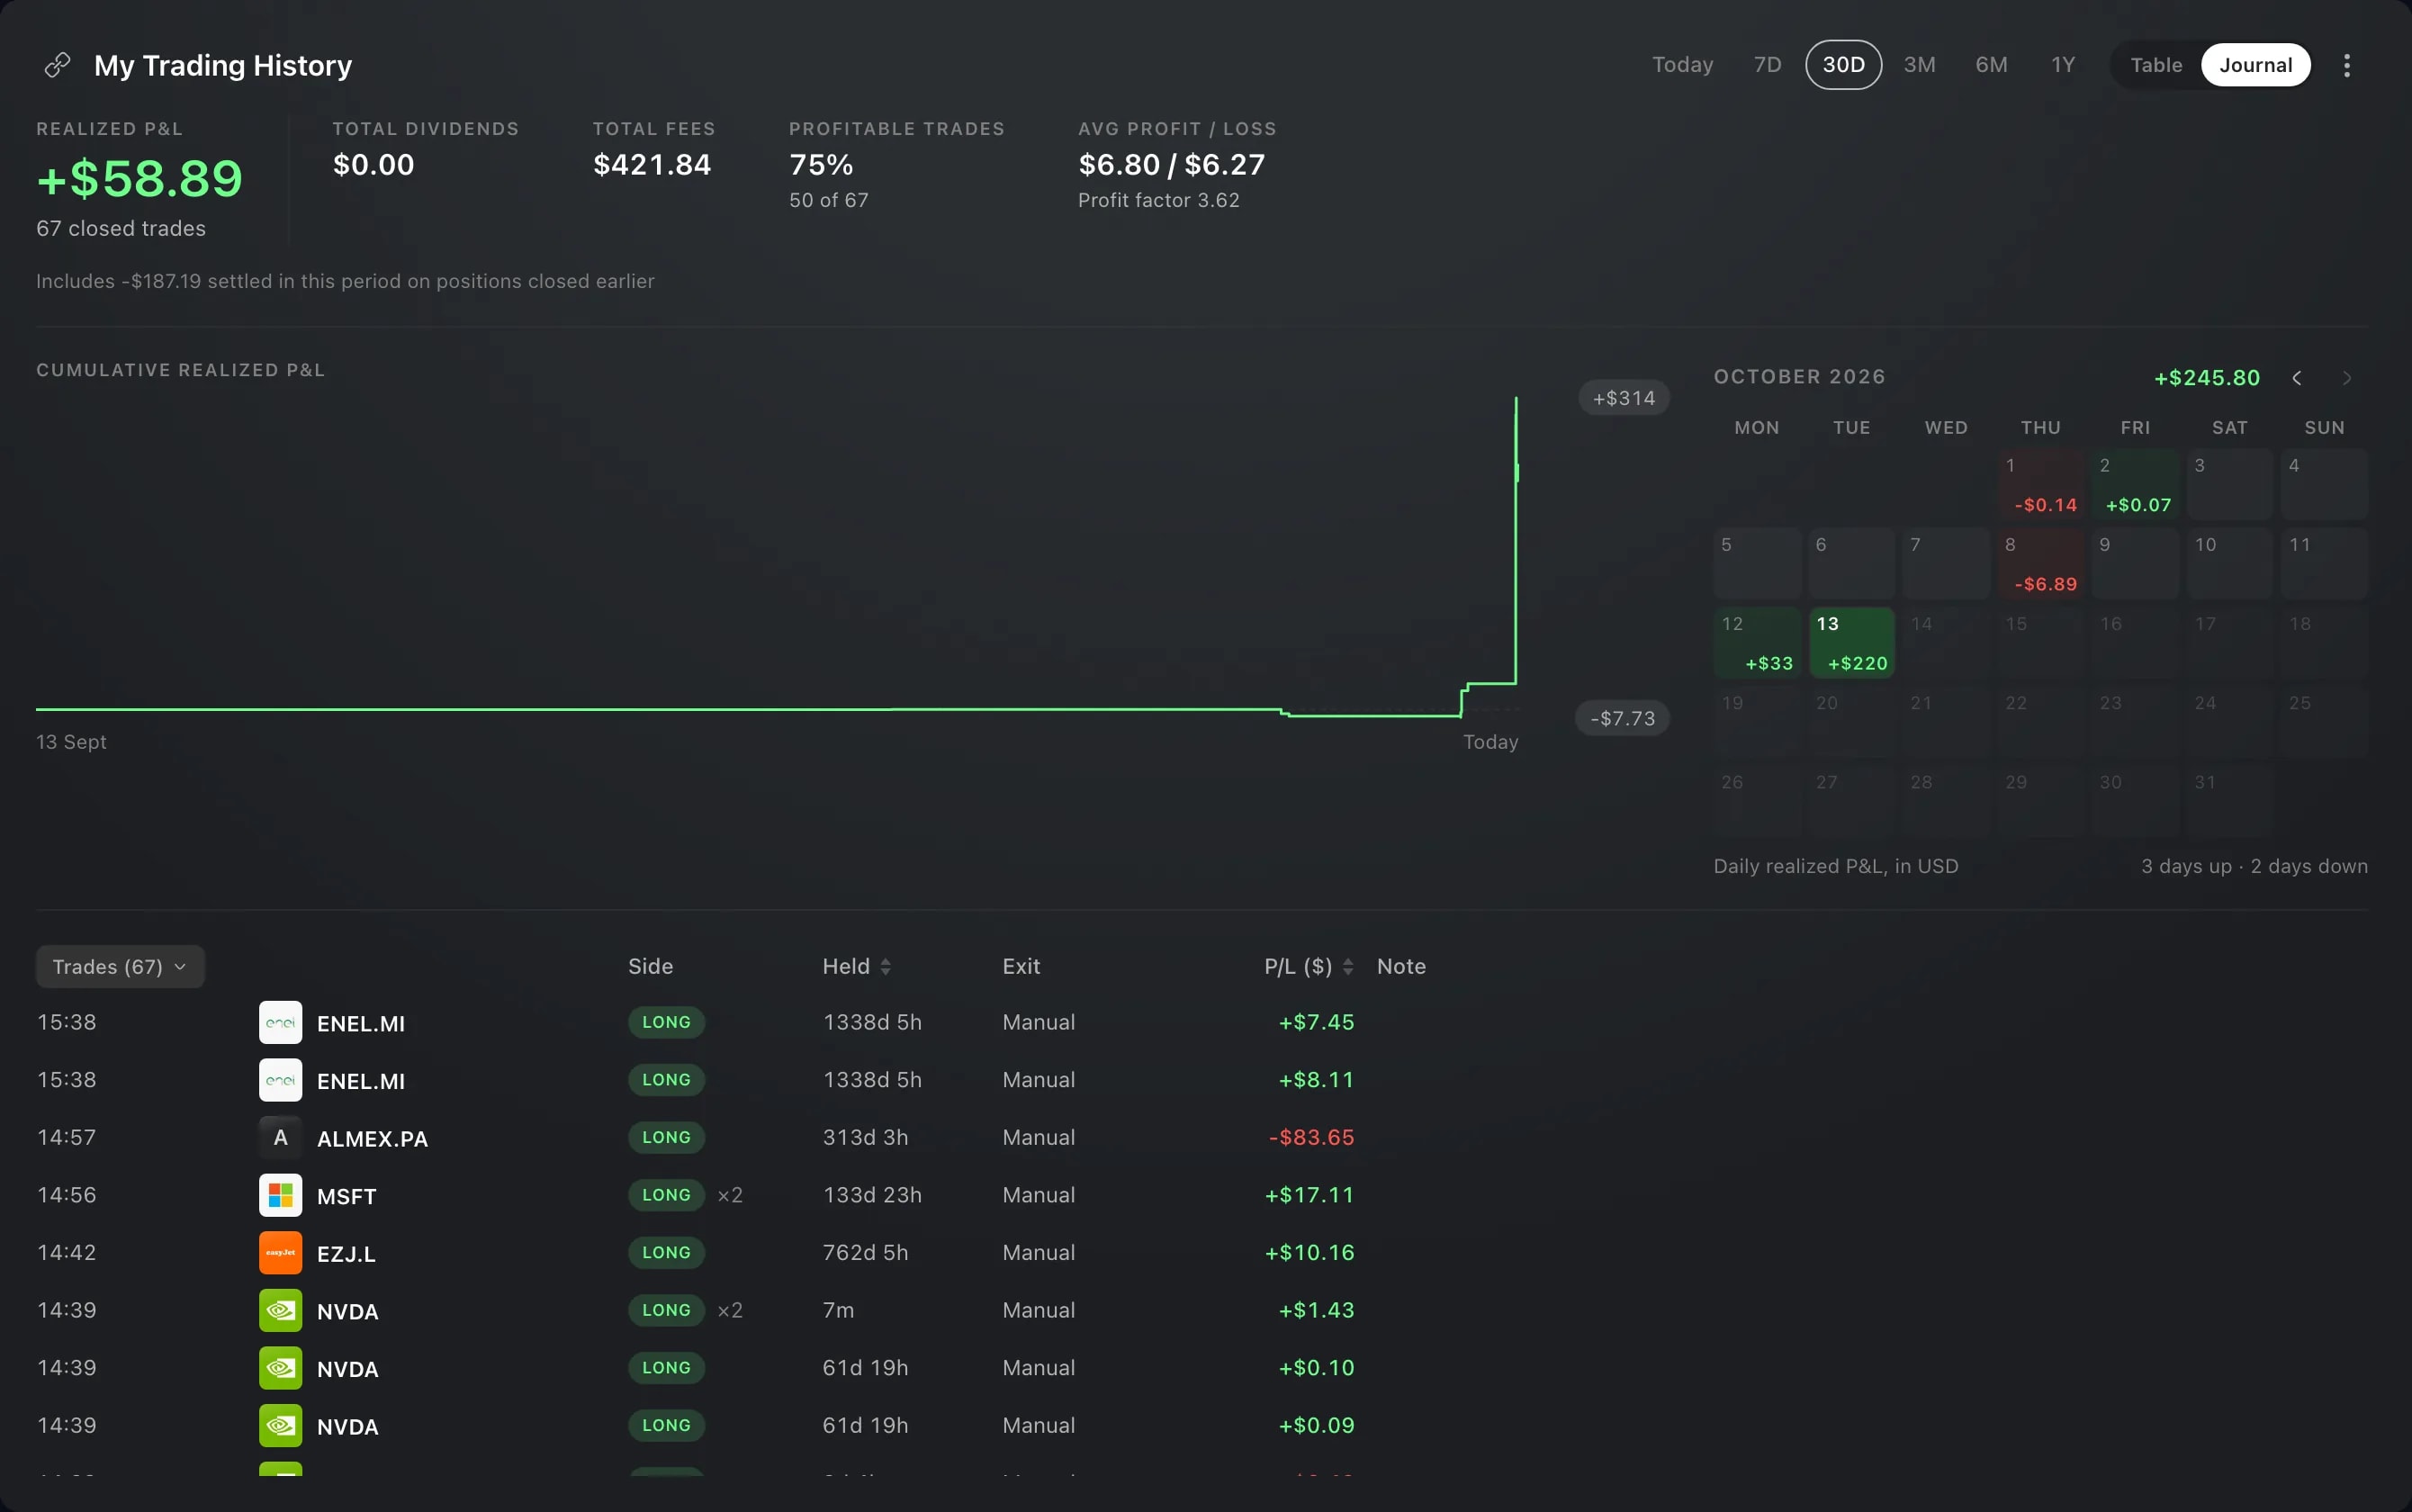
Trading journal
Trade History and My Portfolio have a Journal view: the period's Realized P&L as a curve and a calendar, closed trades grouped your way, and your notes.
Charts
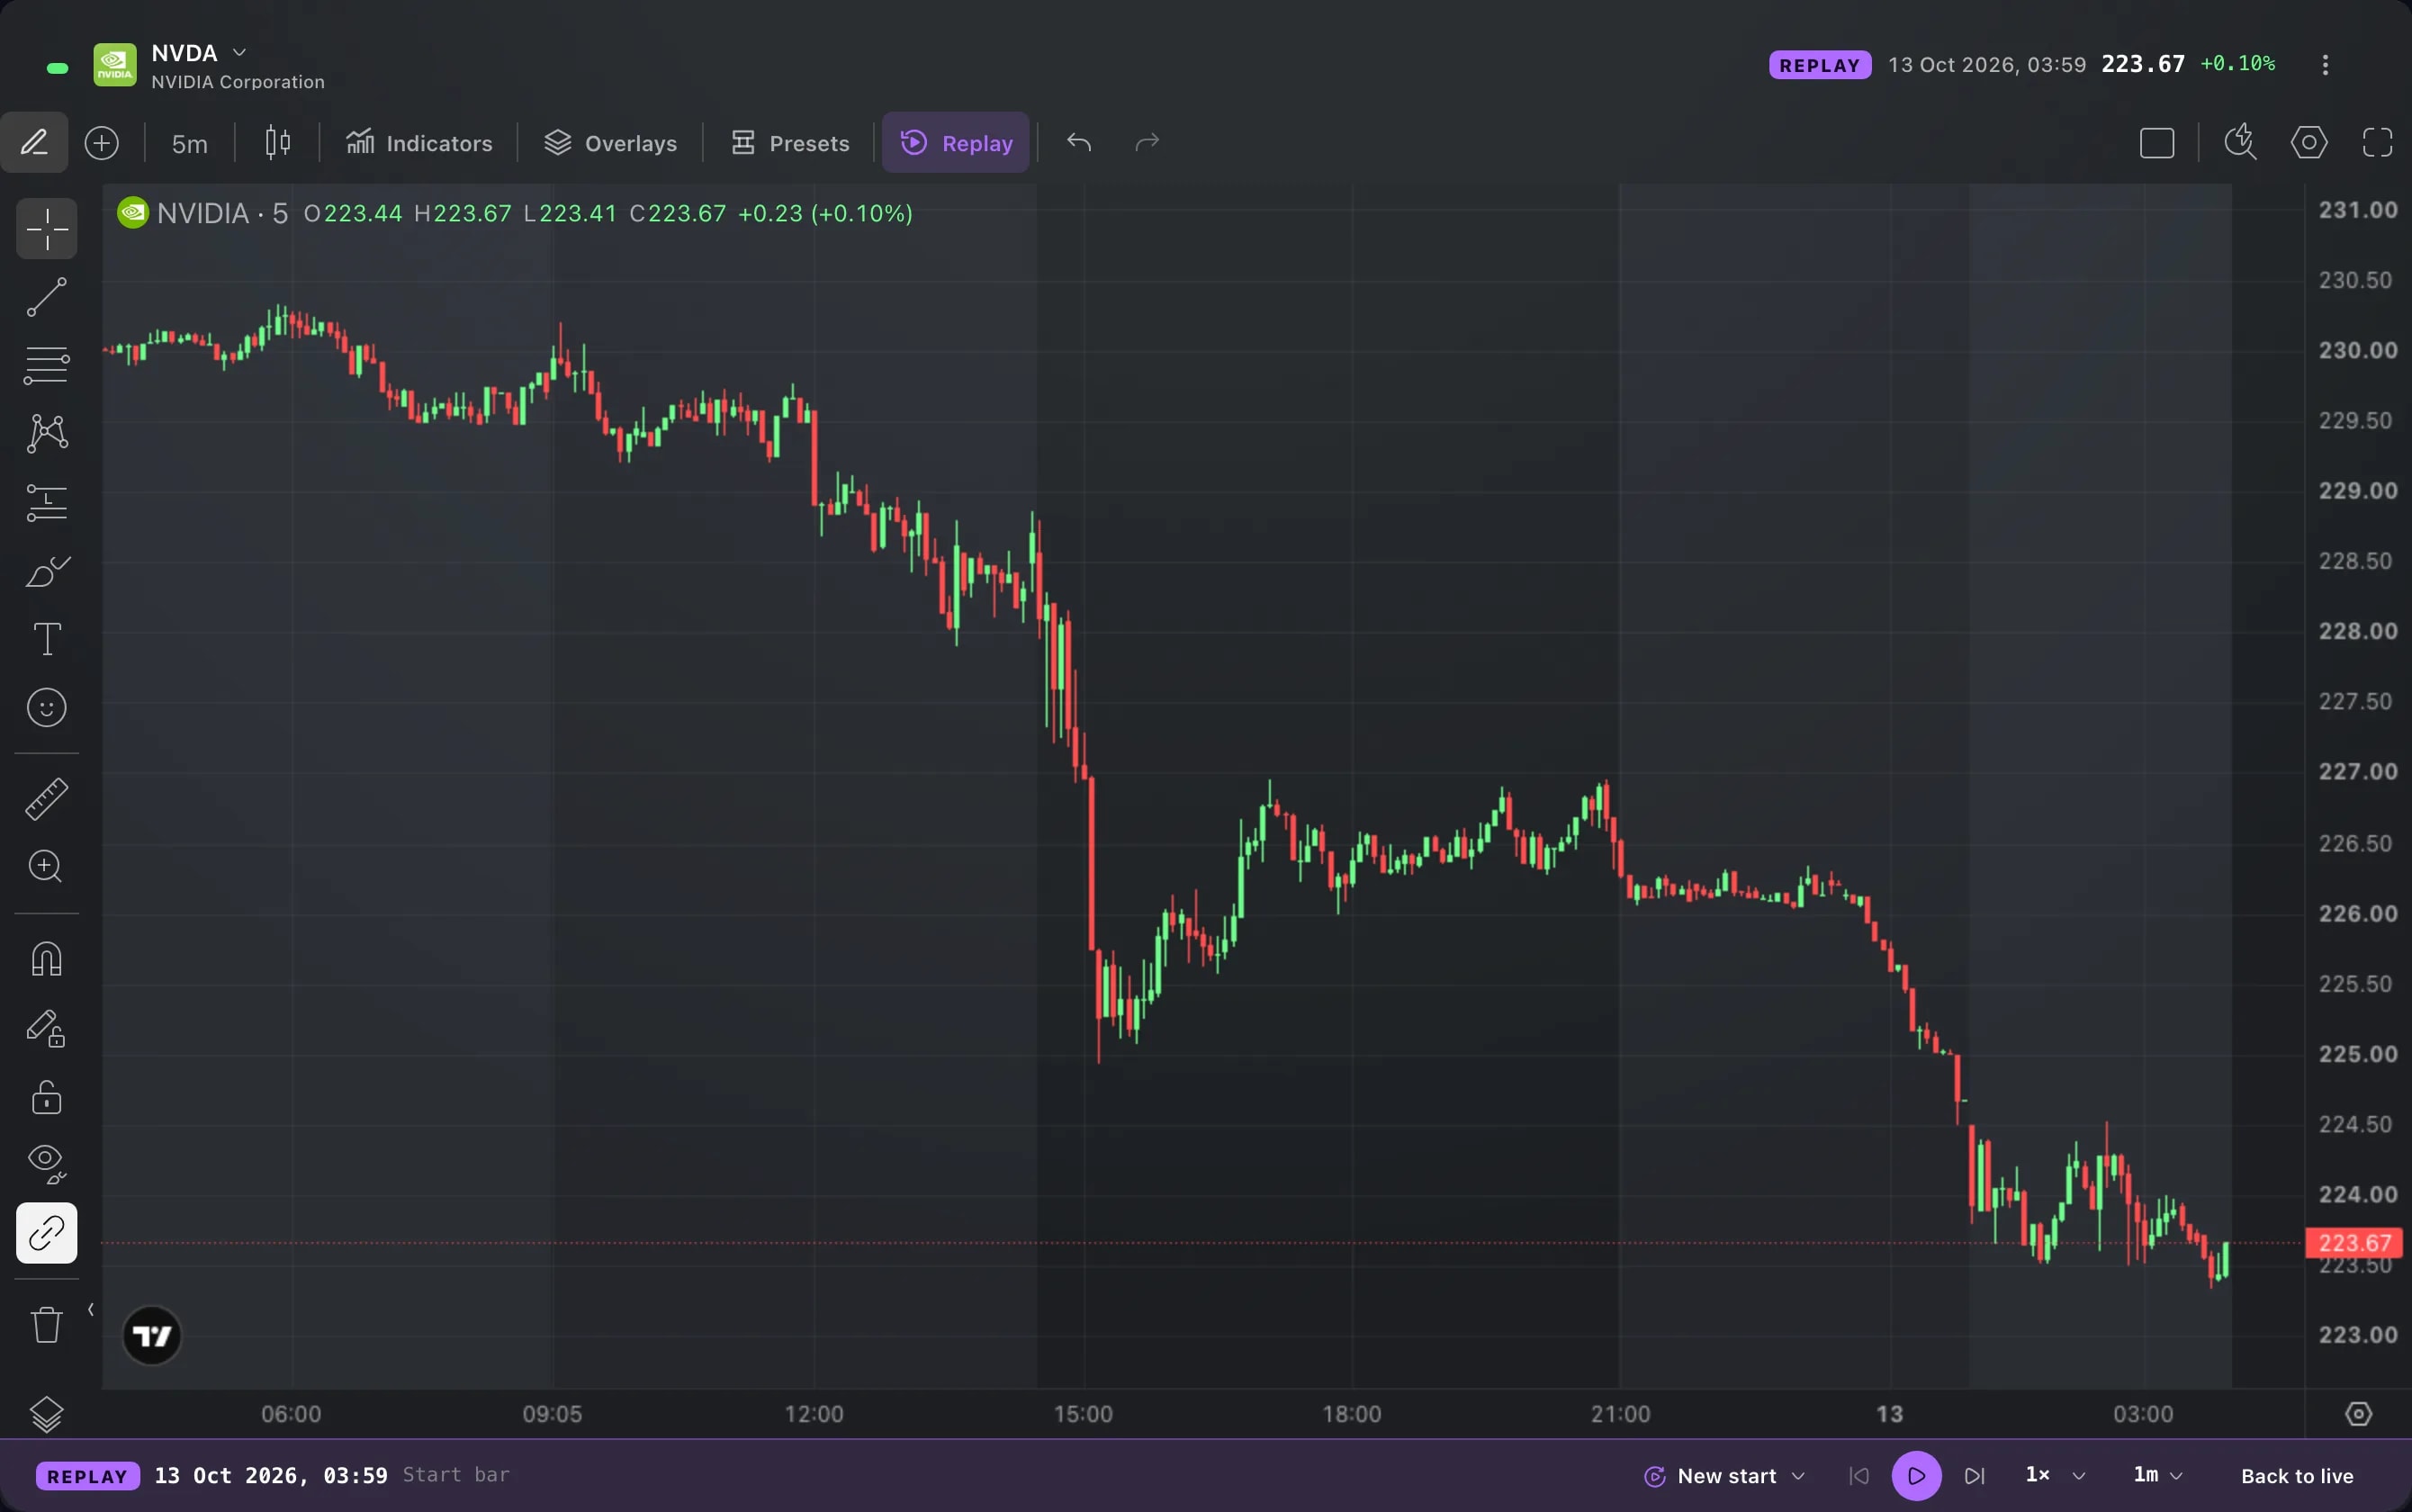
Replay the chart
Play back any instrument's price history bar by bar, from the moment you choose and at the speed you choose.
App
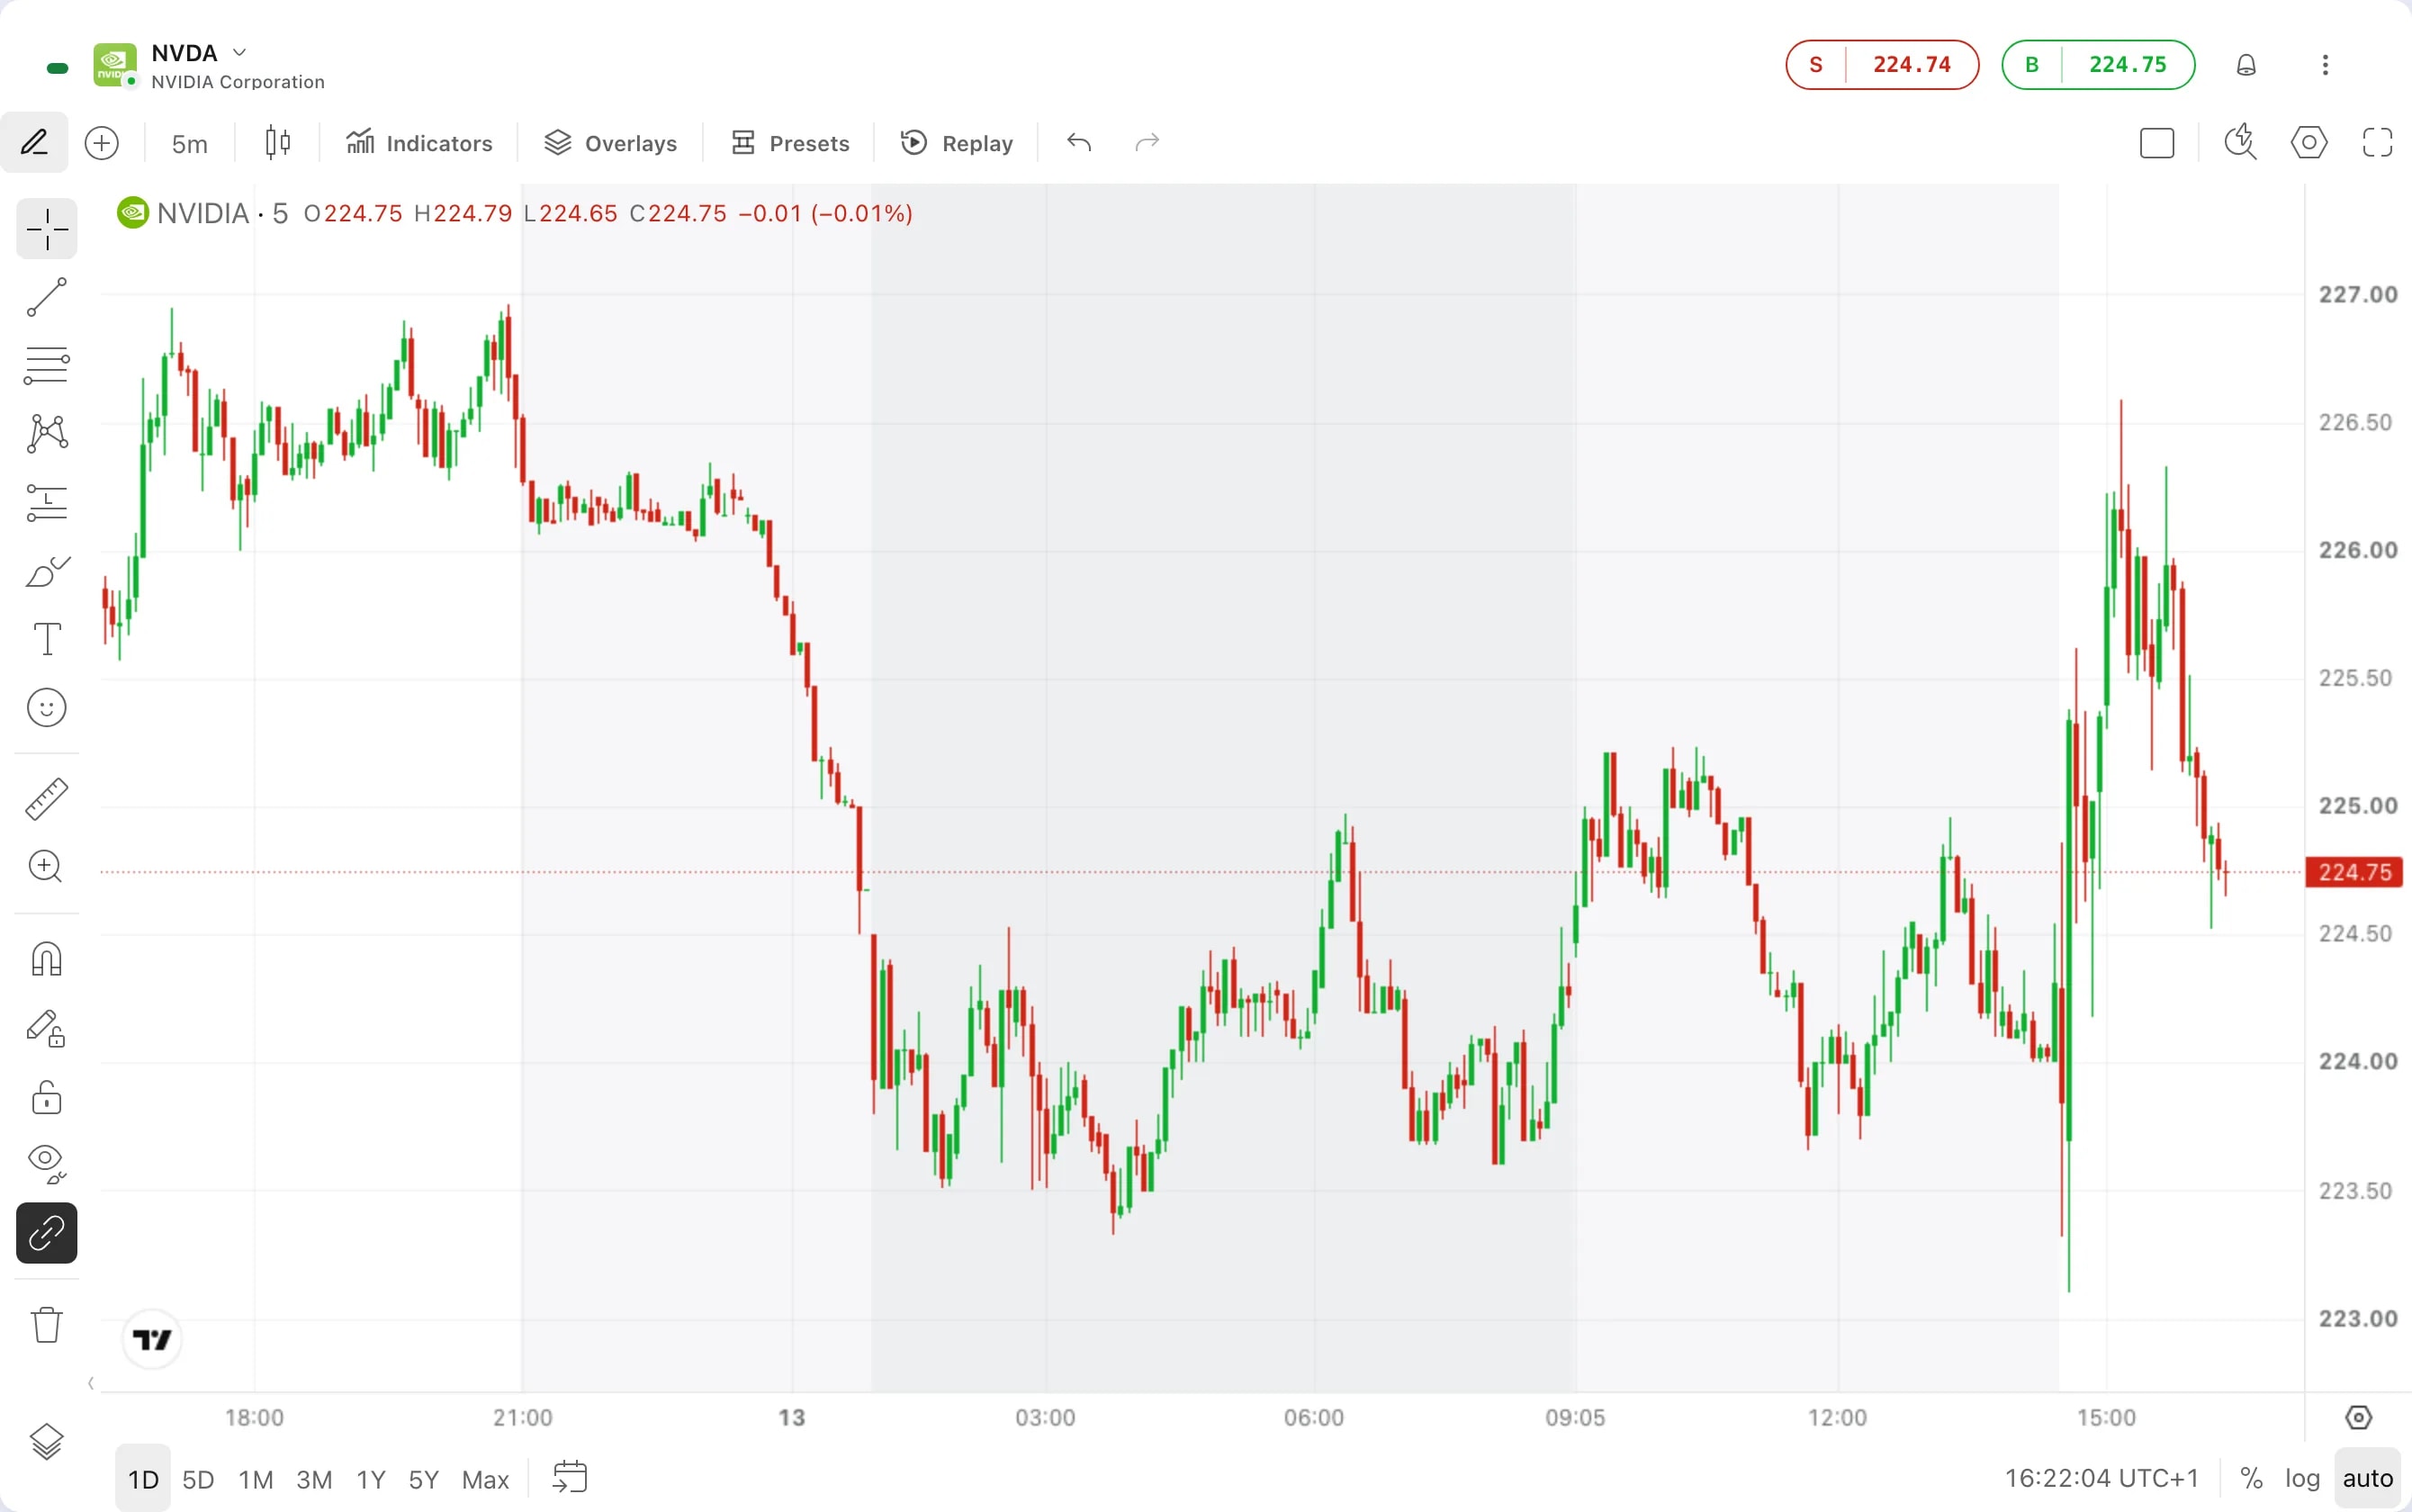
Light theme
Edge now comes in light as well as dark. Choose Light, Dark or System in Settings, and the whole workspace follows, charts included.
September 2026
Charts
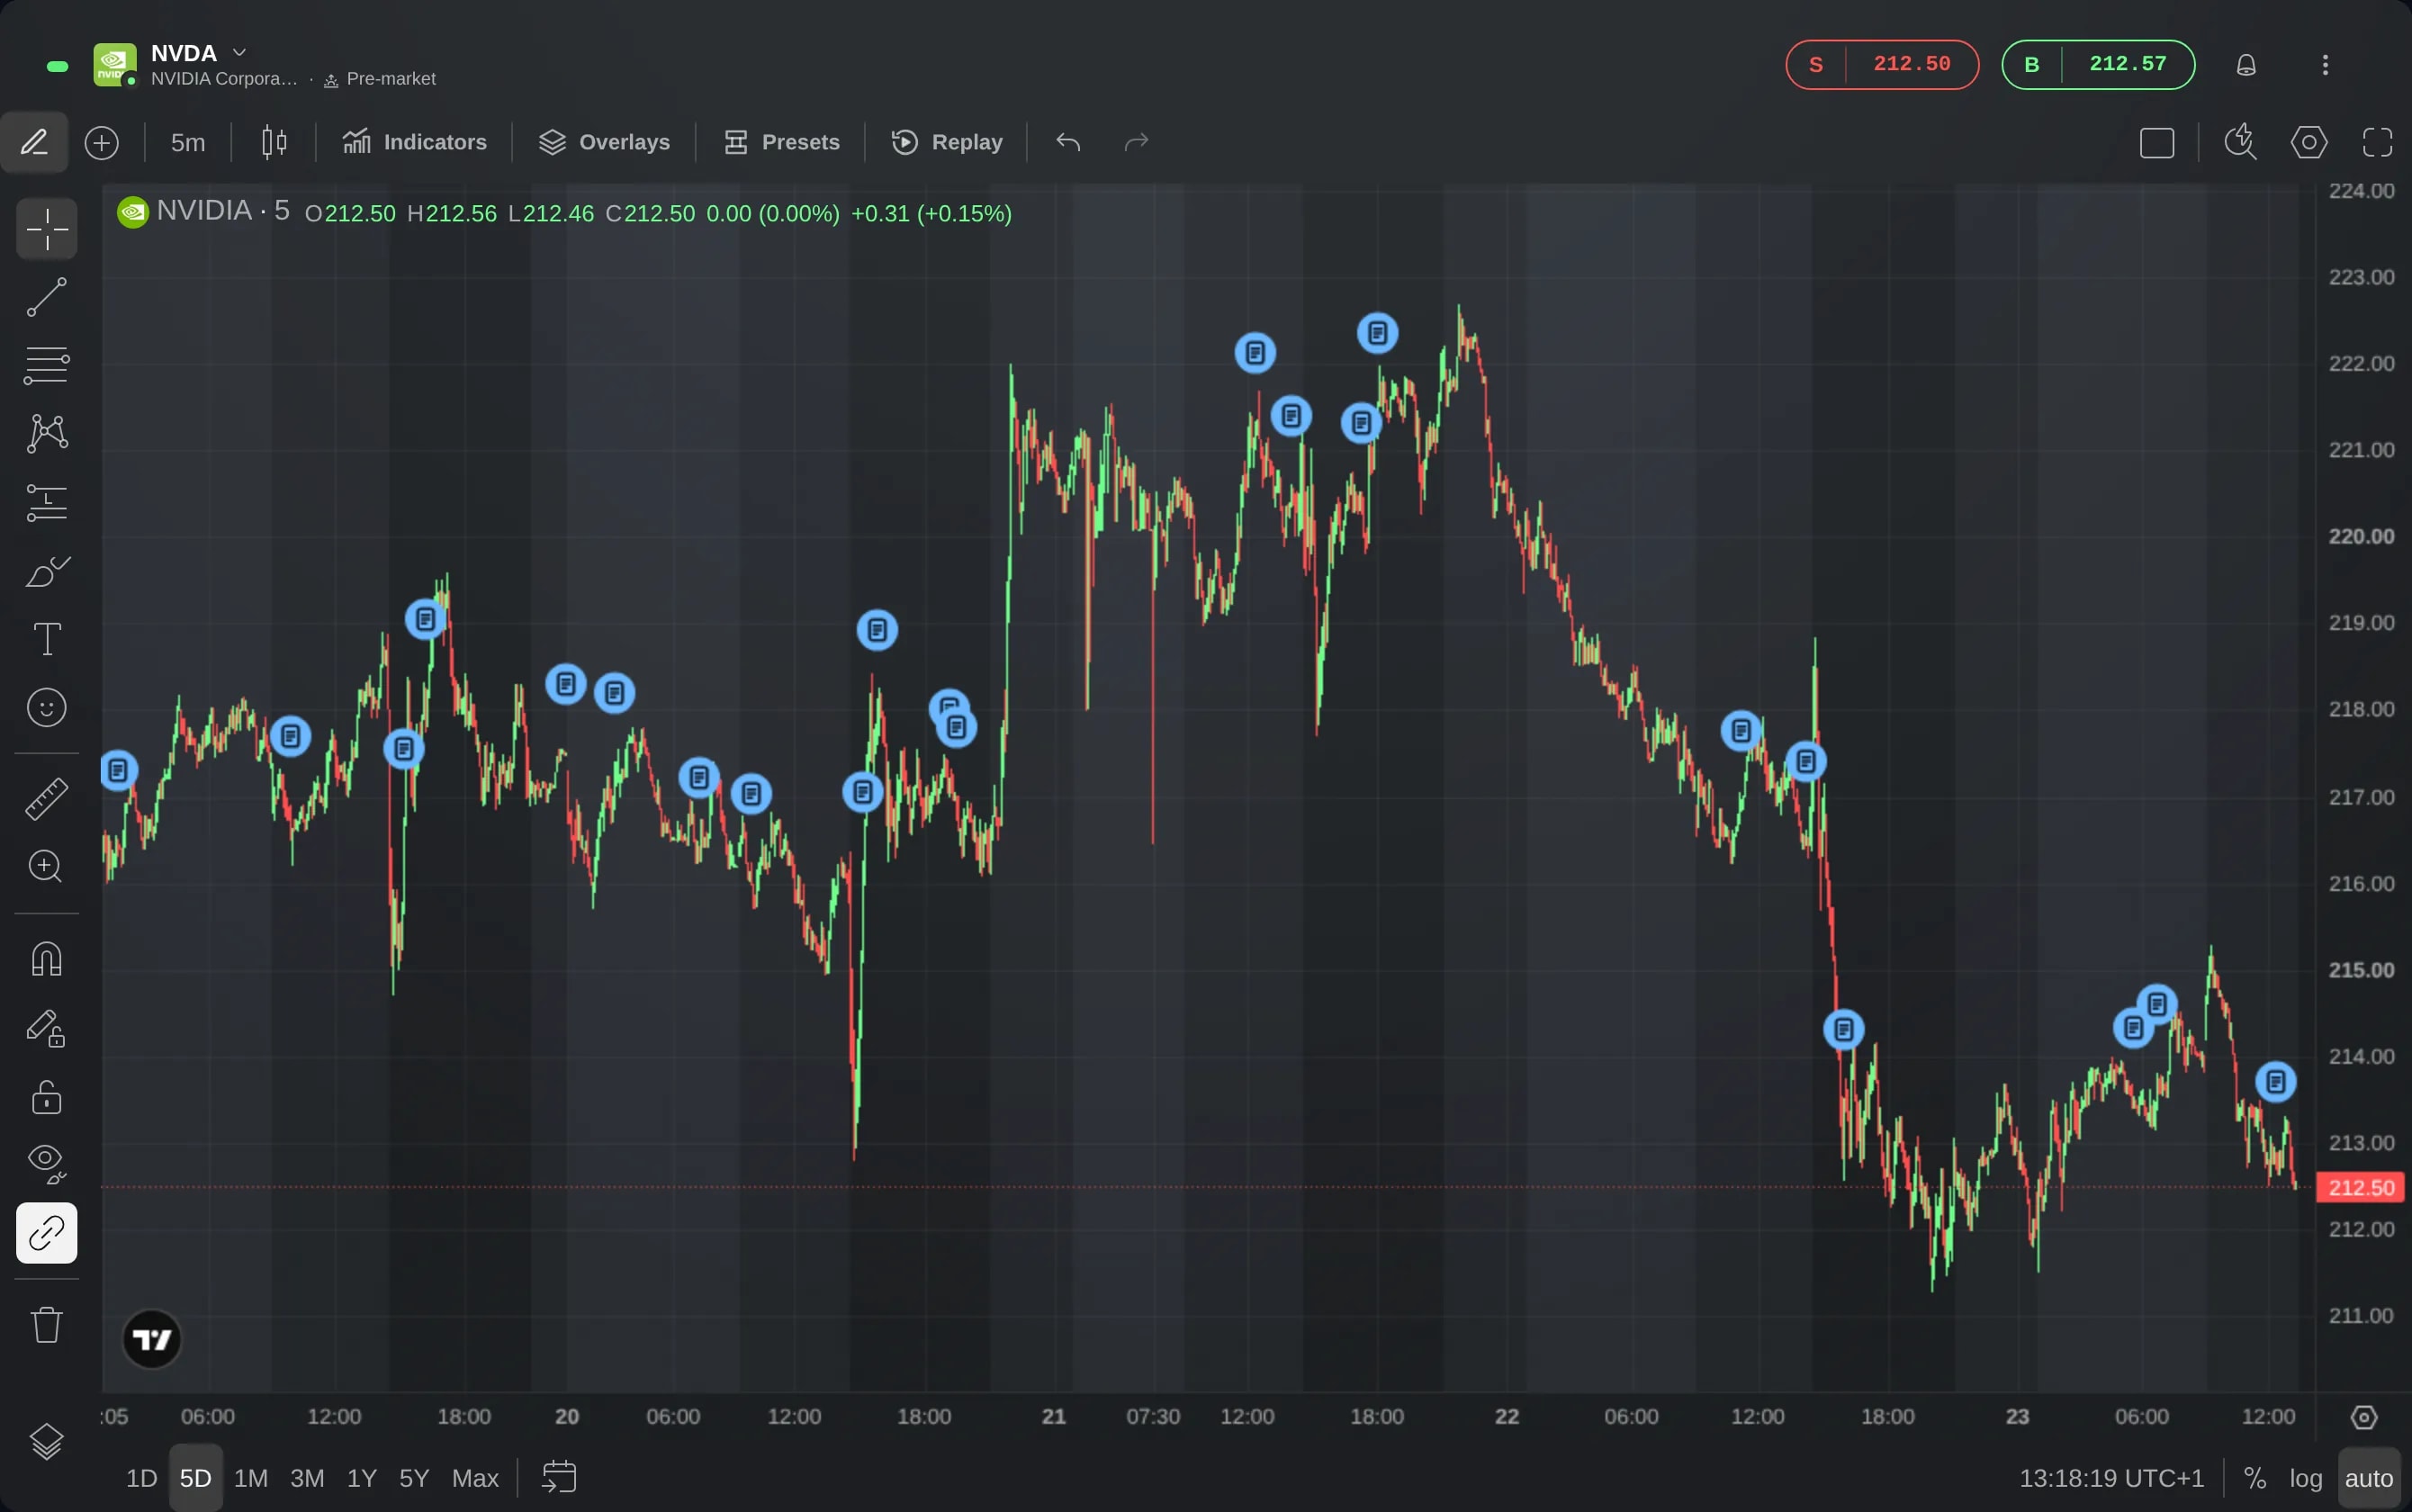
News on the chart
Turn on News in a chart's Overlays to see when headlines about the instrument came out, as markers just above the candles. Click a marker to read the stories.
Research
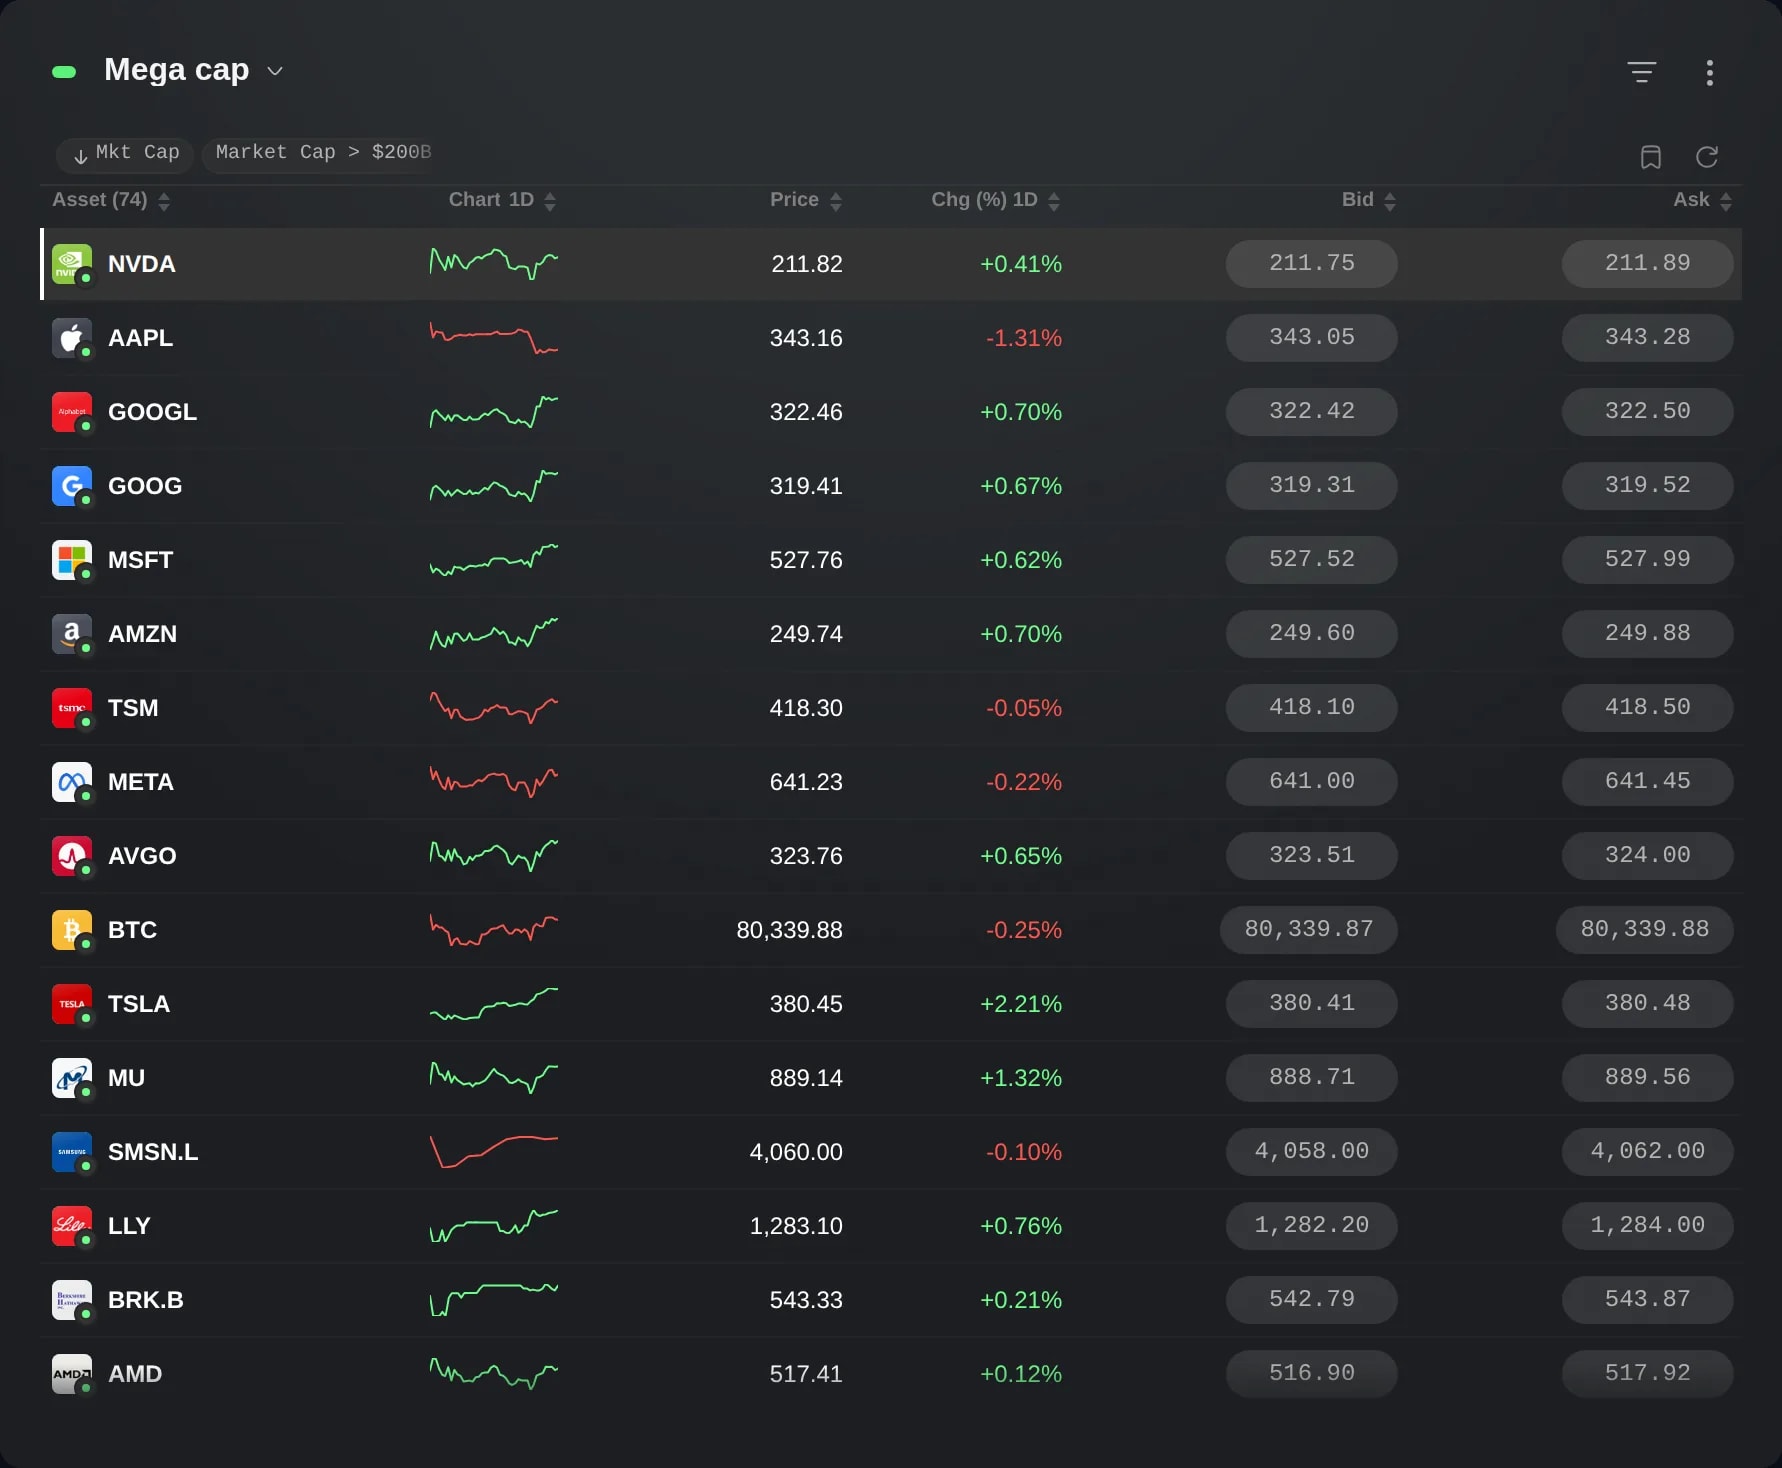
Dynamic lists that keep themselves up to date
Say what belongs on a list and the column it ranks by. Edge re-ranks it every 30 seconds, in Watchlists, the Market Heatmap and Events.
Trading
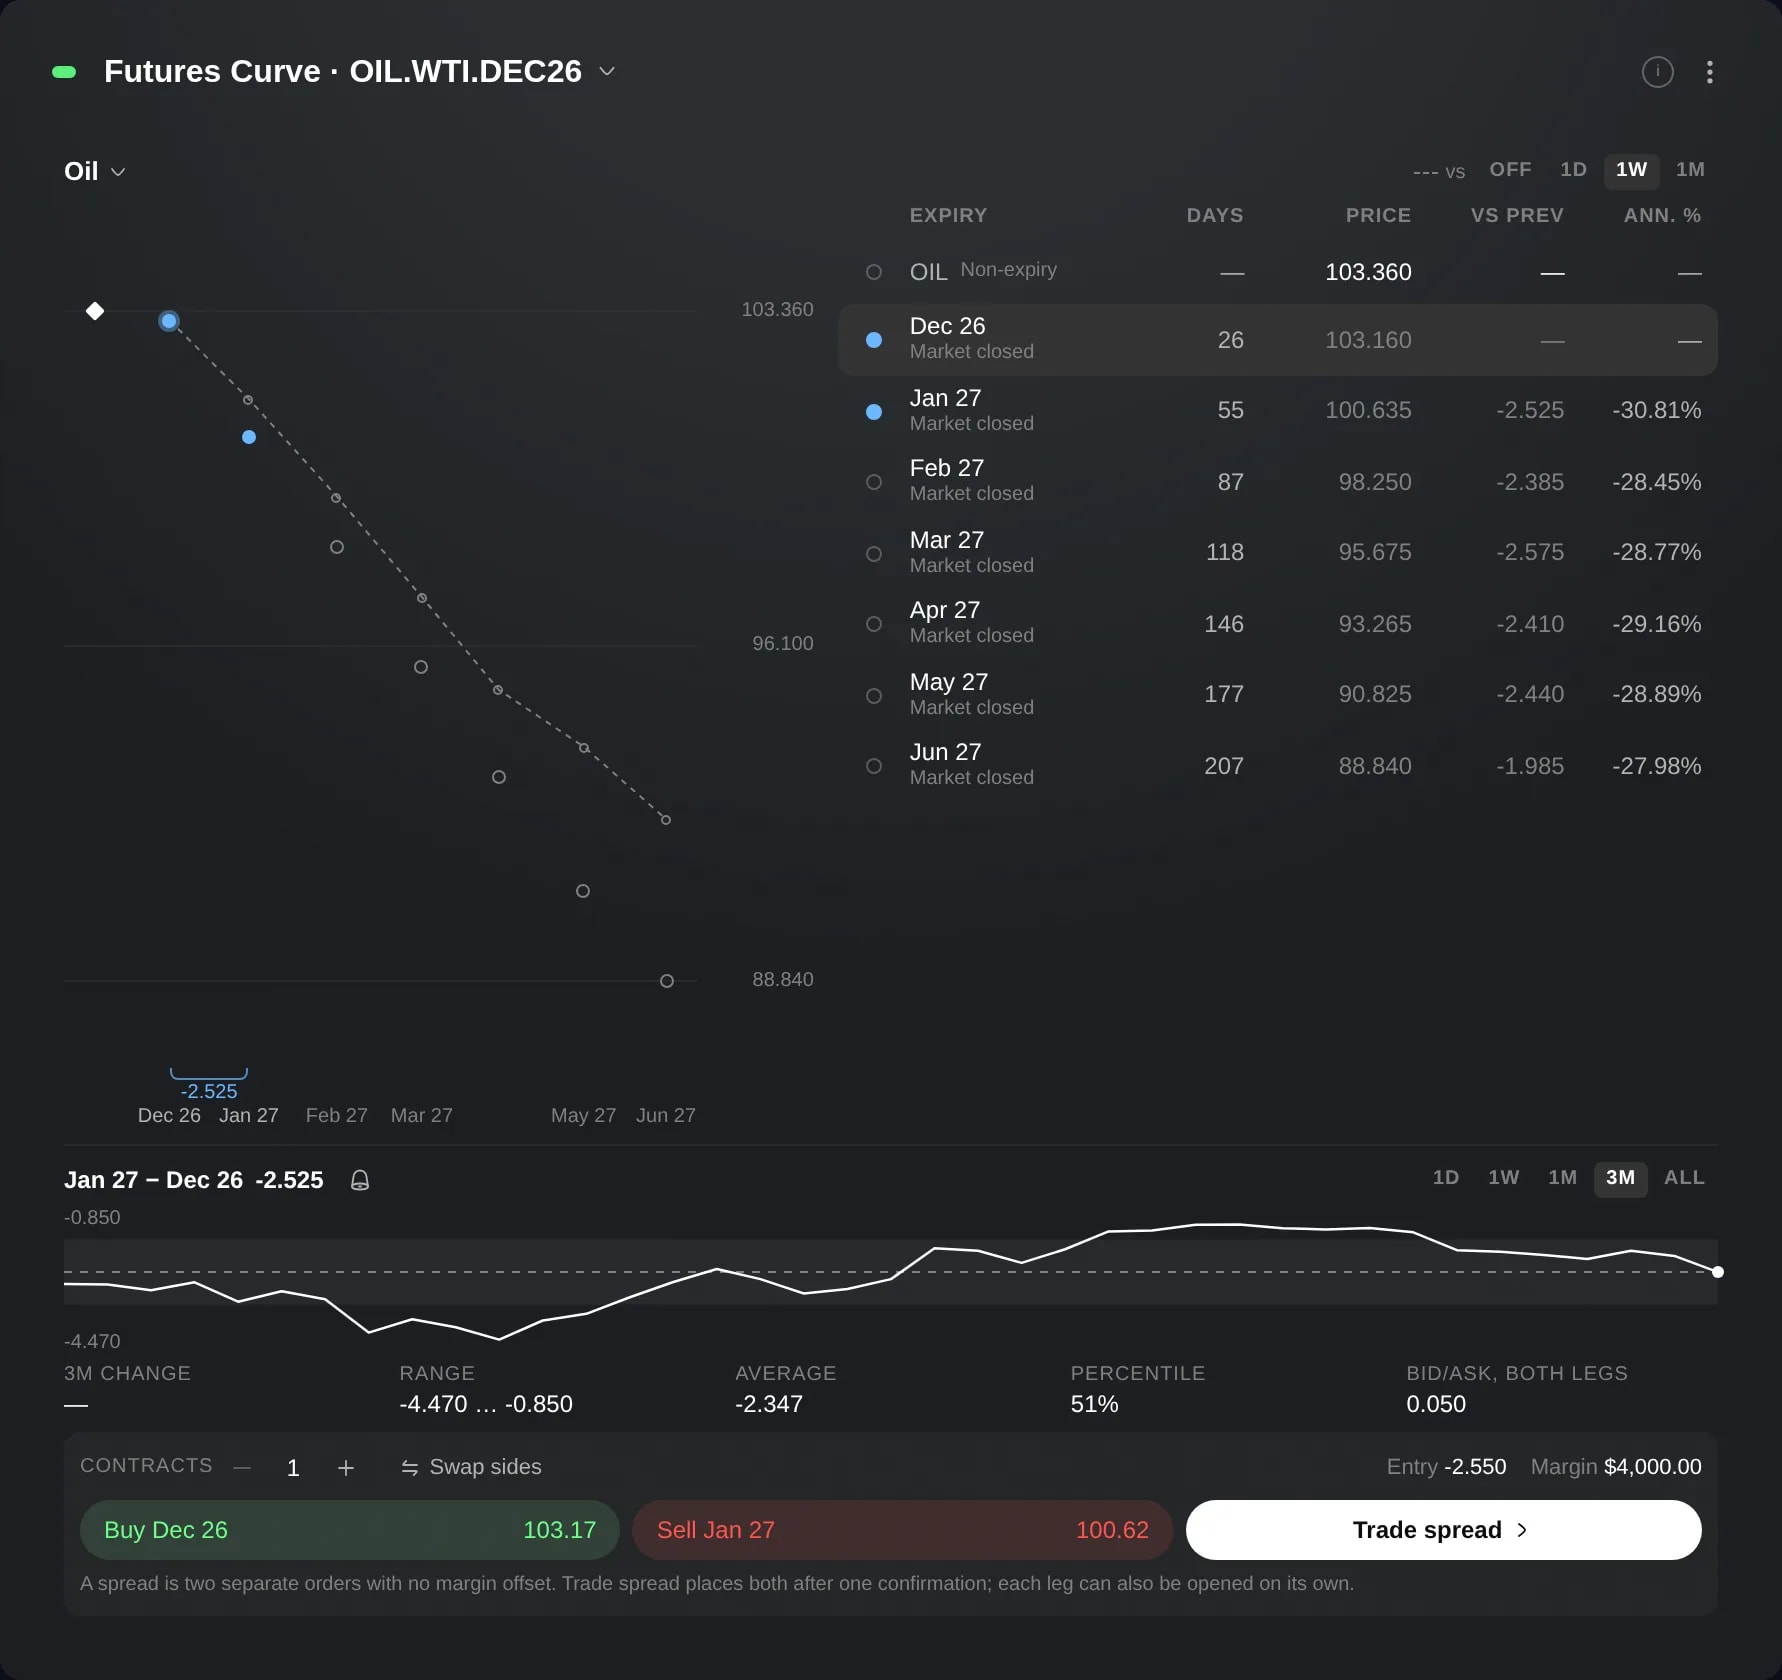
Futures Curve: every expiry of a future on one chart
See every listed expiry of one futures market on a single curve, beside a table of its contracts, and the spread between any two of them with its history.
Research
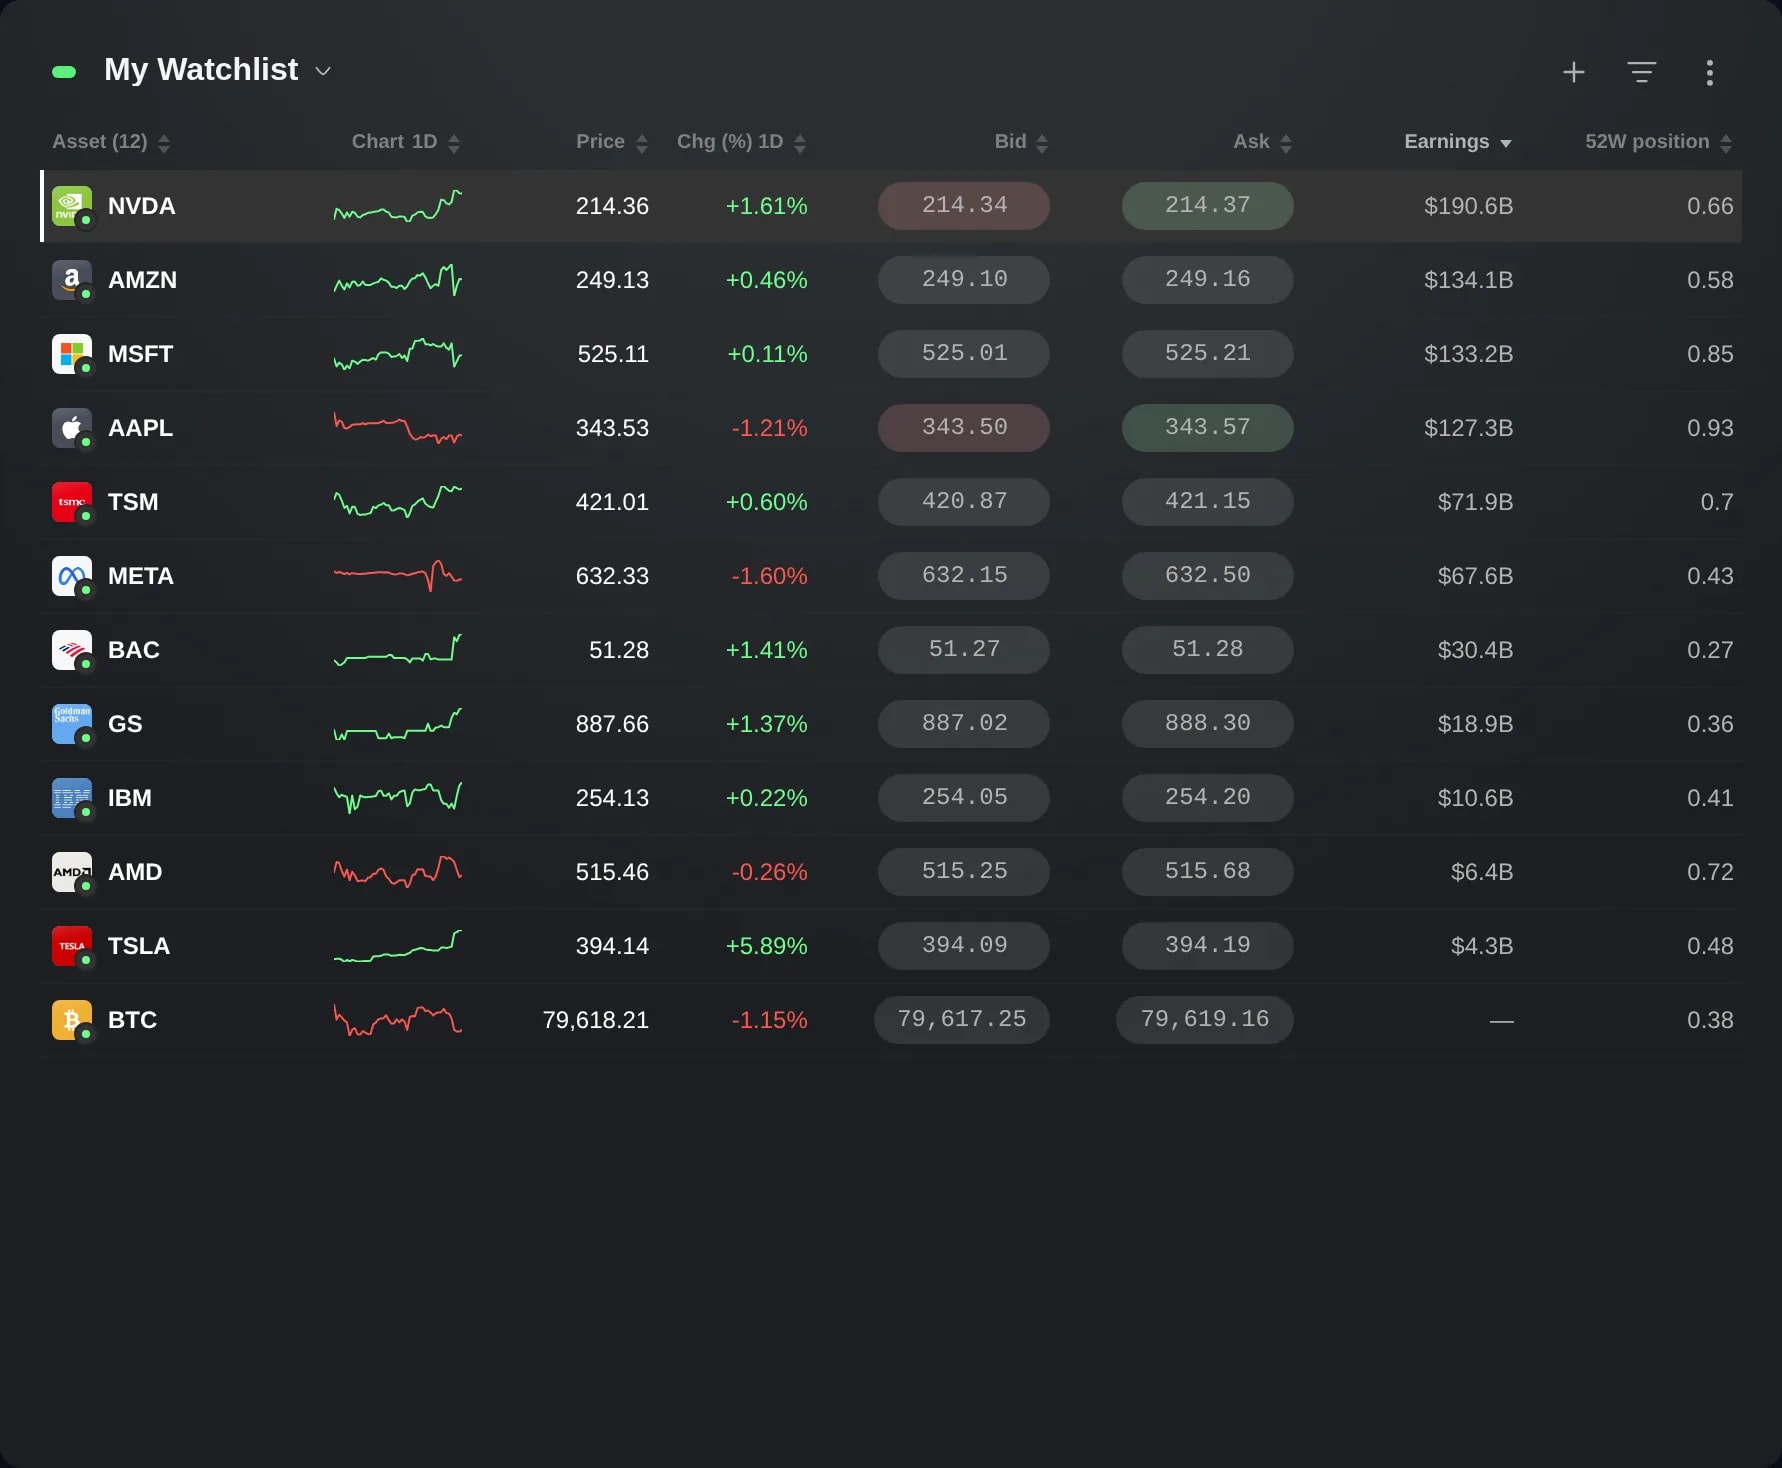
Columns with your own formulas
Add a column you define to Watchlists, the Screener or Portfolio Positions: a name and a formula over the table's fields, such as market cap divided by P/E.
Tori
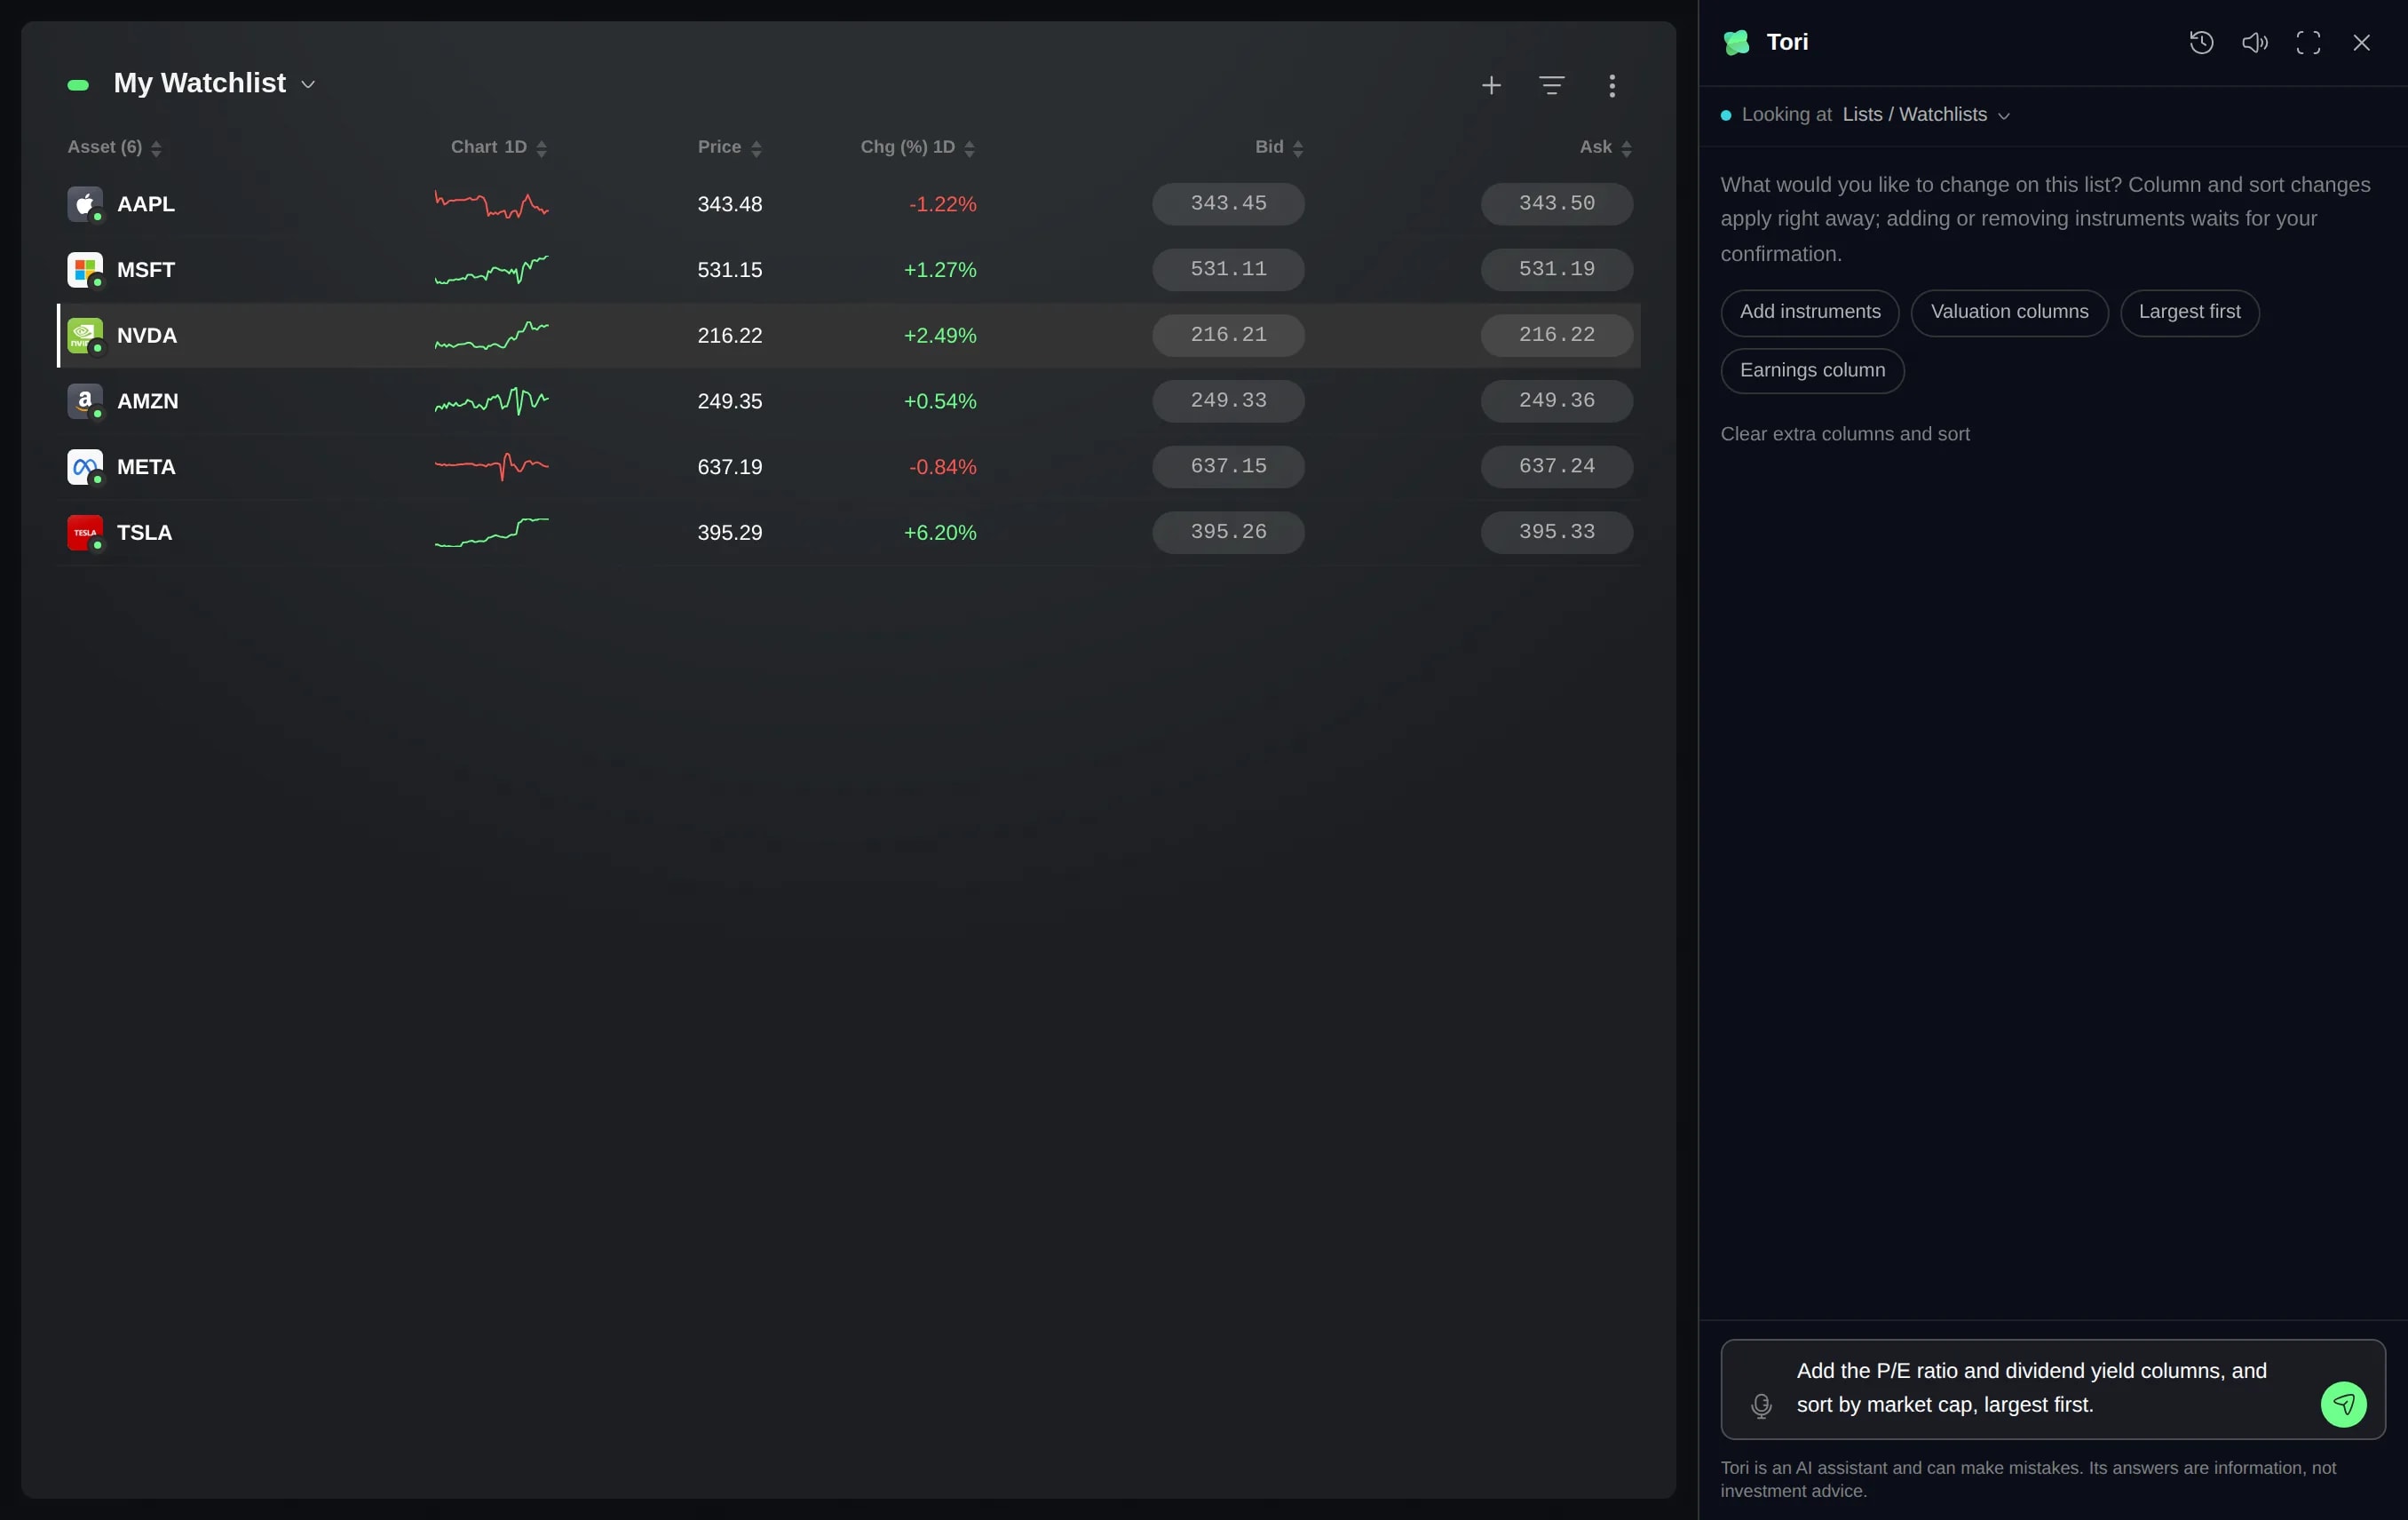
Edit widgets with Tori
Say what you want and Tori changes the chart, watchlist, Screener or portfolio table you opened it from. A list's instruments and your positions change only once you confirm.
App
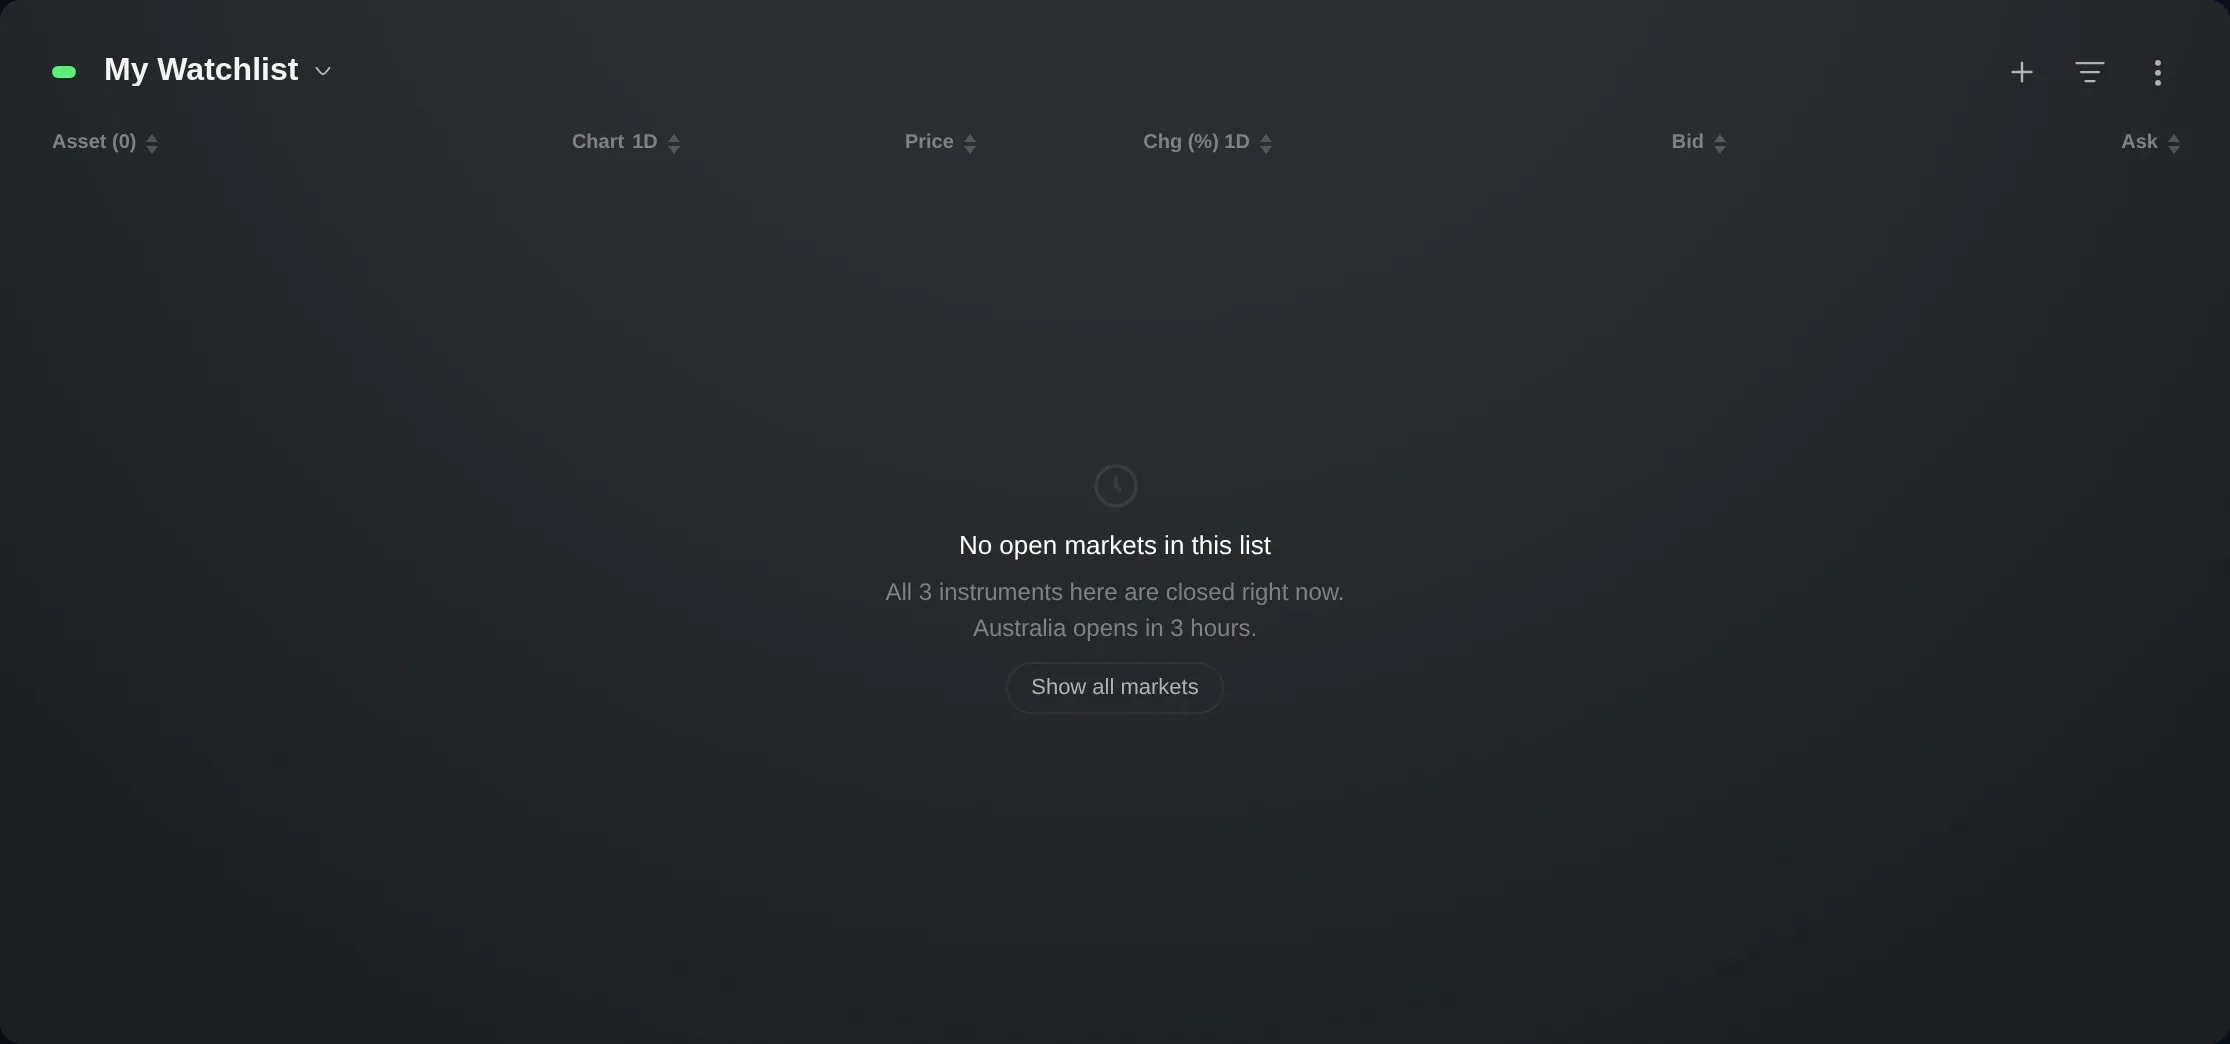
Show only open markets
Hide closed-market rows across your layout with one filter, then bring them back without changing your lists or account totals.
Trading
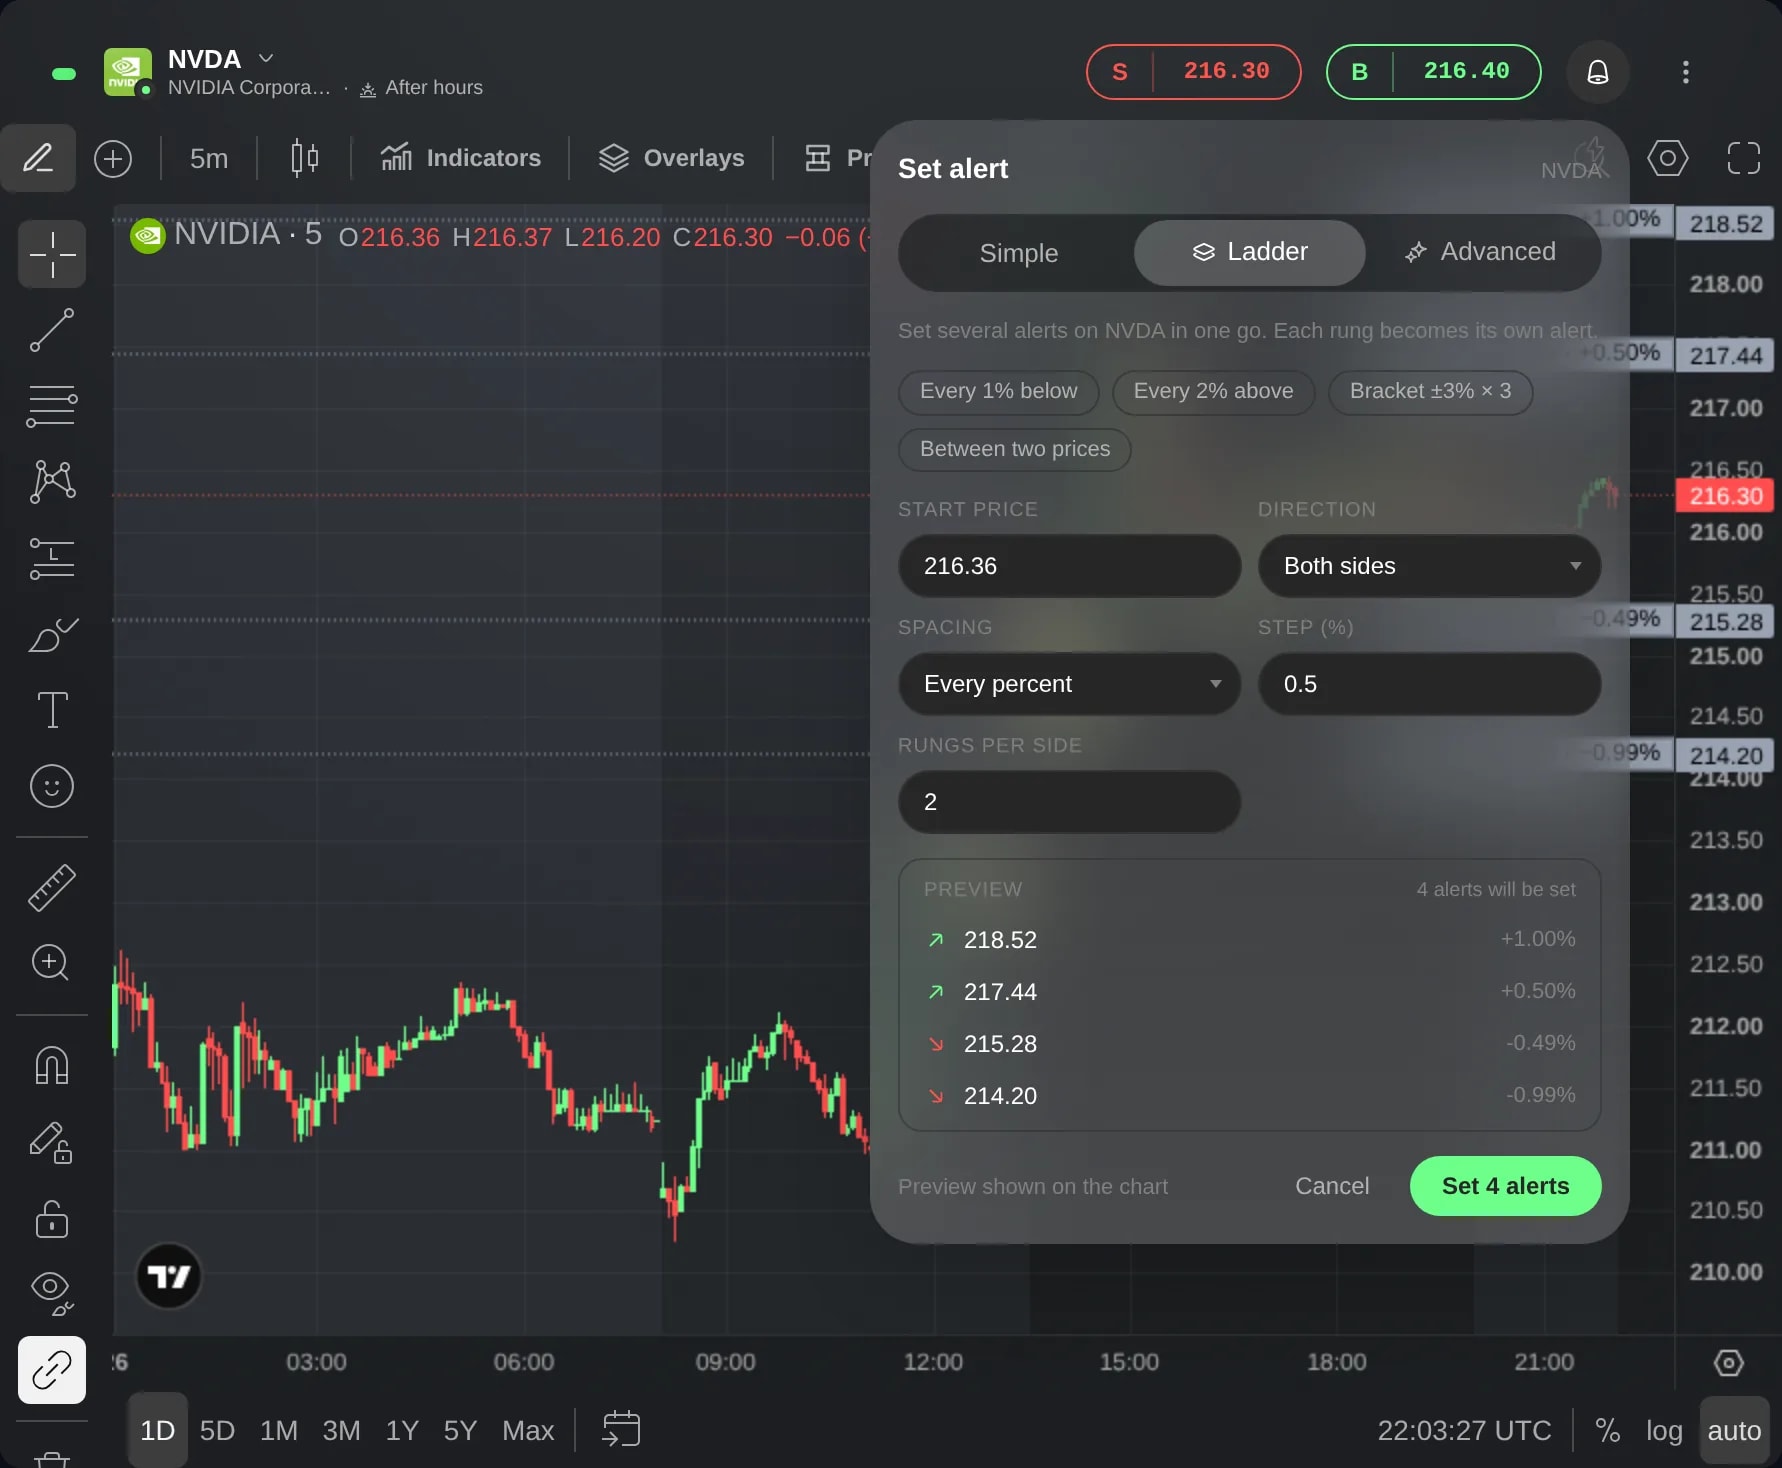
Several alerts per instrument, and alert ladders
Keep several price alerts on one instrument and change each one where it is listed, or set a whole ladder of alerts at regular steps in one go.
Charts
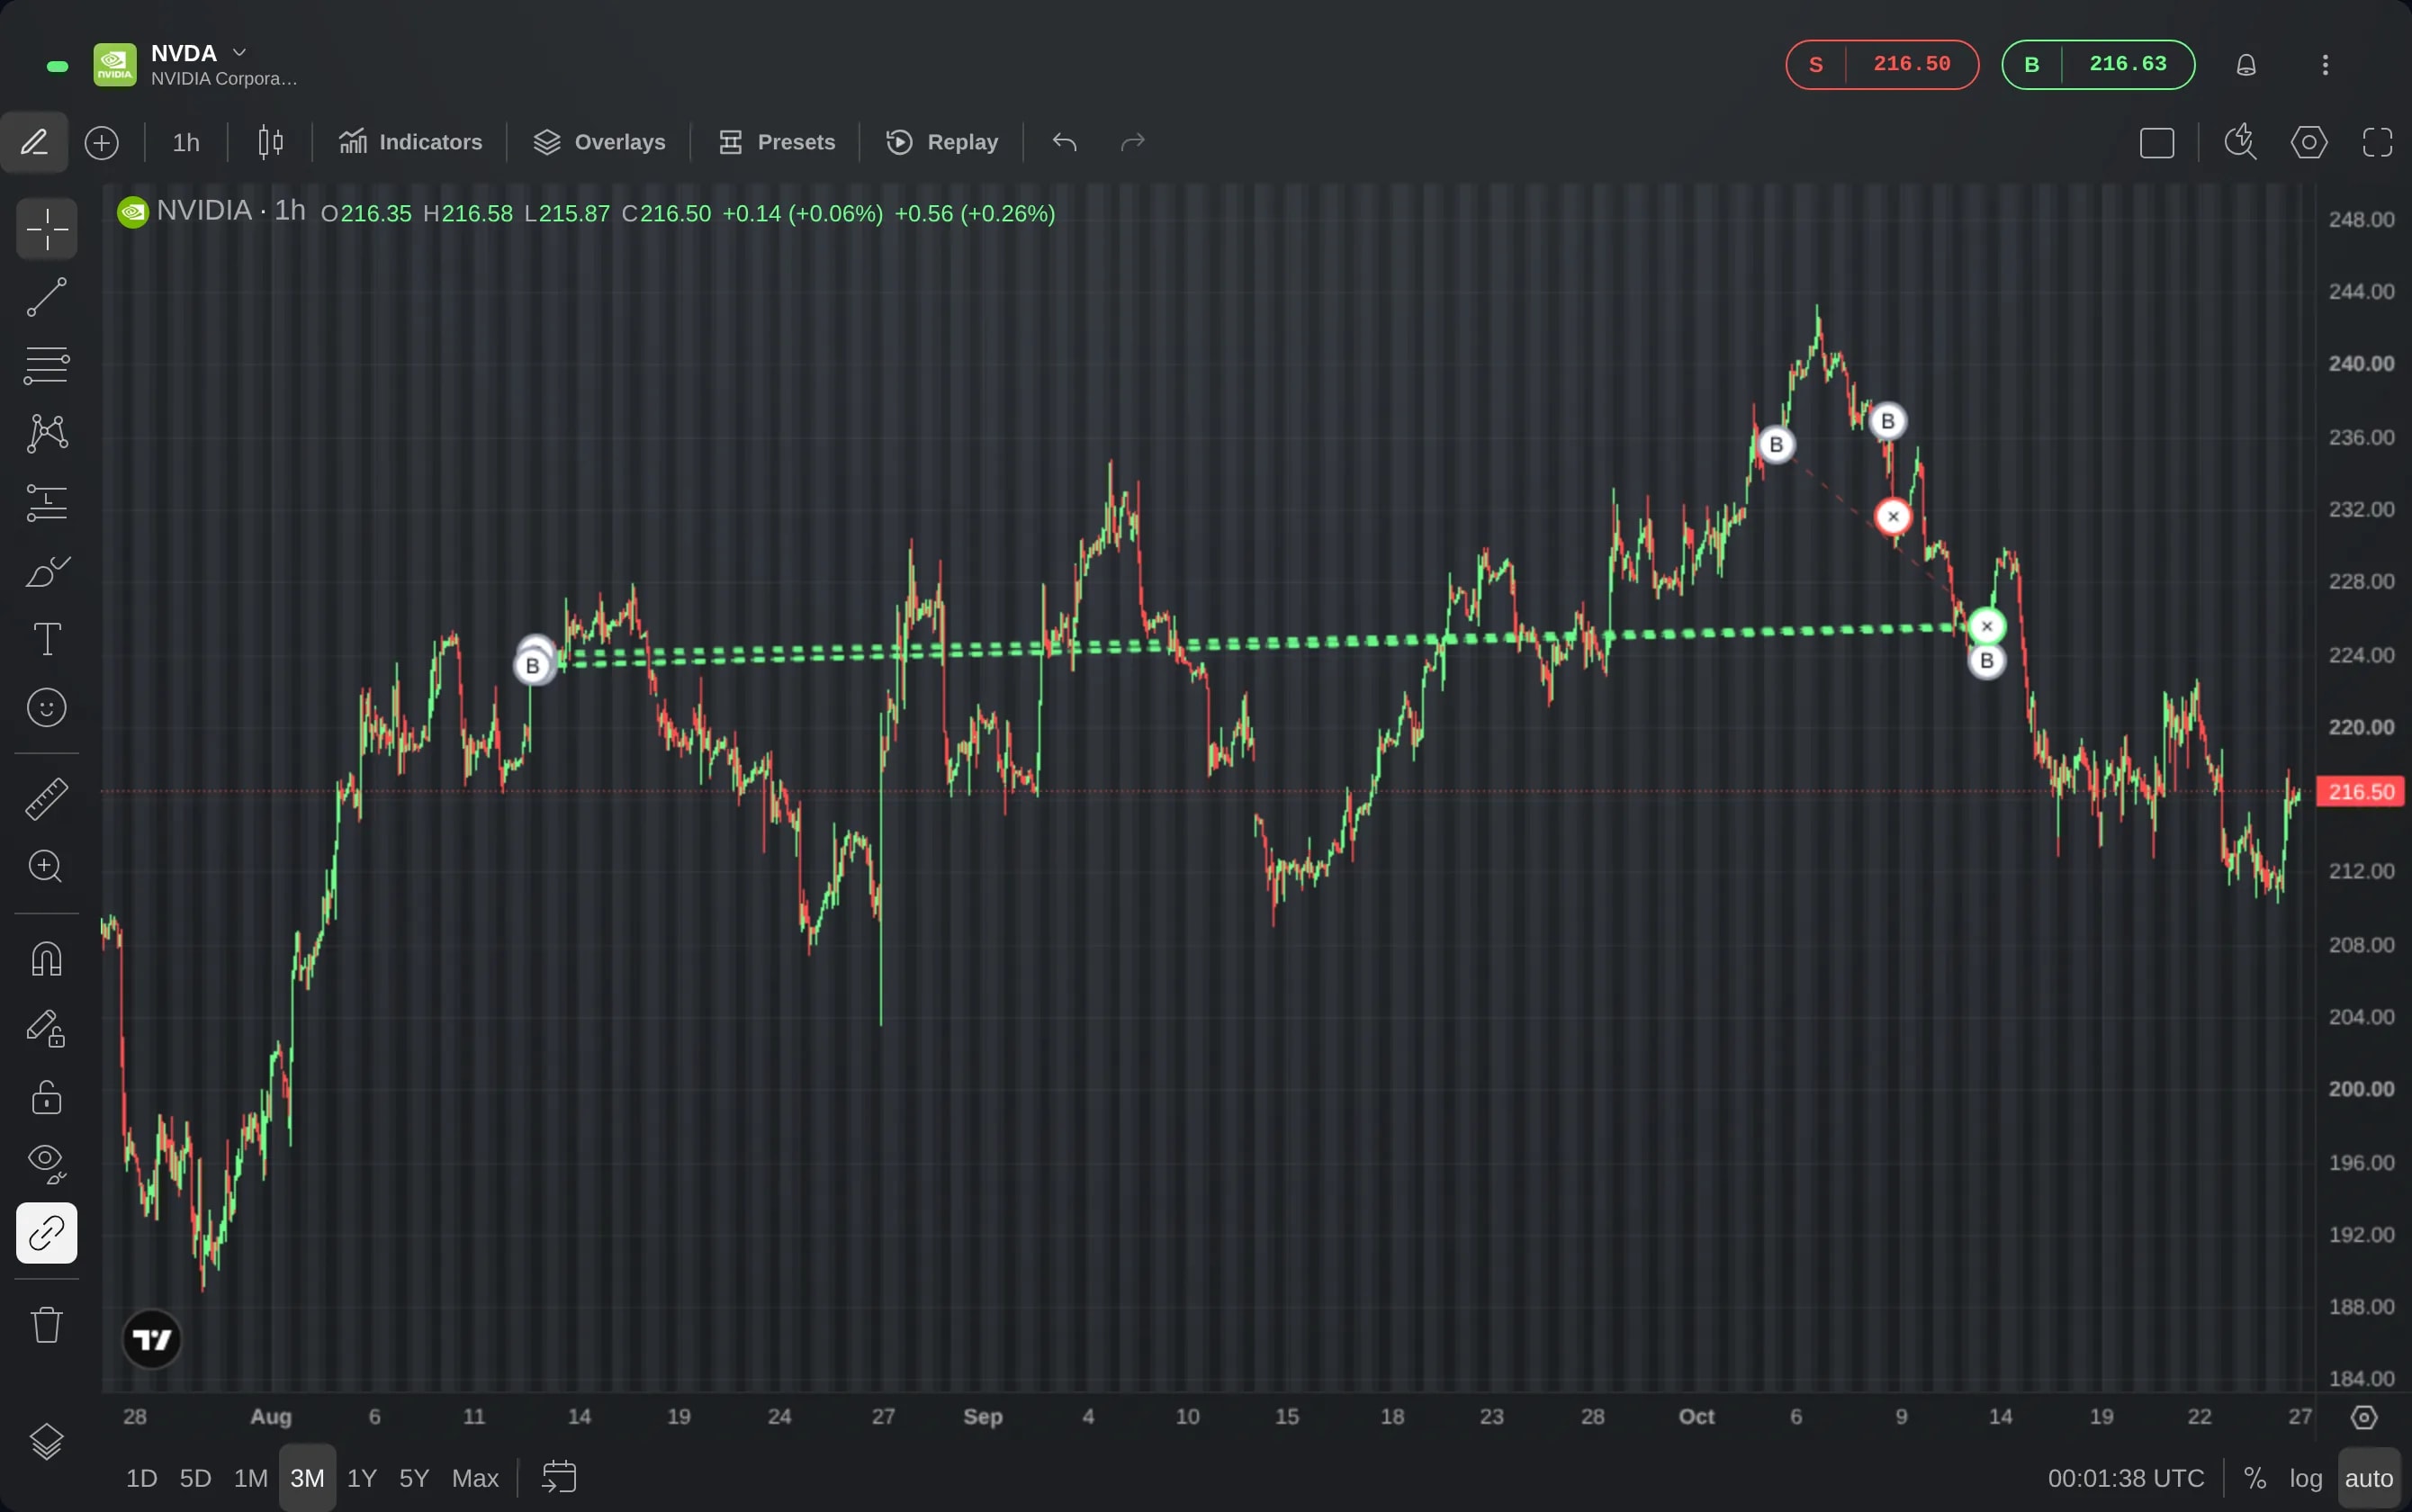
Your closed trades on the chart
Turn on Closed trades in a chart's Overlays to see where each of your past trades on the instrument opened and closed, colored by its result.
Portfolio
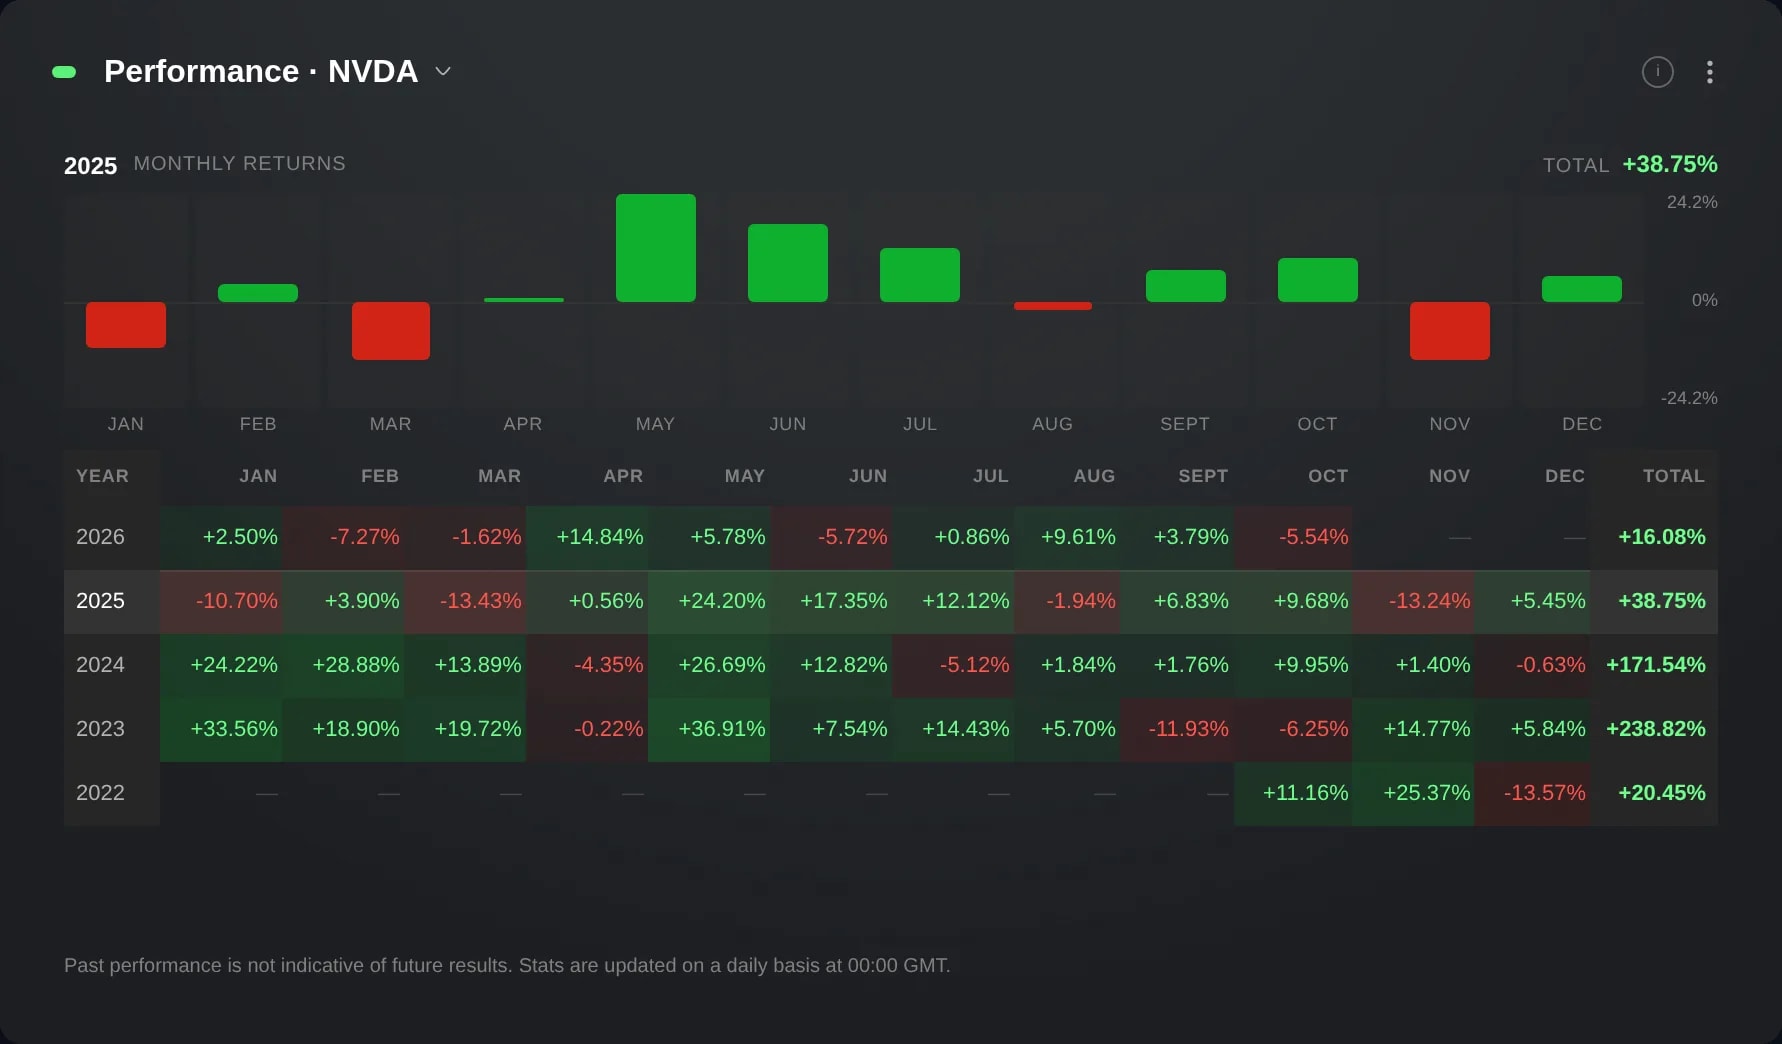
Performance: monthly and yearly returns at a glance
Returns month by month and year by year, as a bar chart over a table: for your account, an investor or a Smart Portfolio as etoro publishes them, or for an instrument.