Portfolio
Trading journal
Trade History and My Portfolio have a Journal view: the period's Realized P&L as a curve and a calendar, closed trades grouped your way, and your notes.
What it is
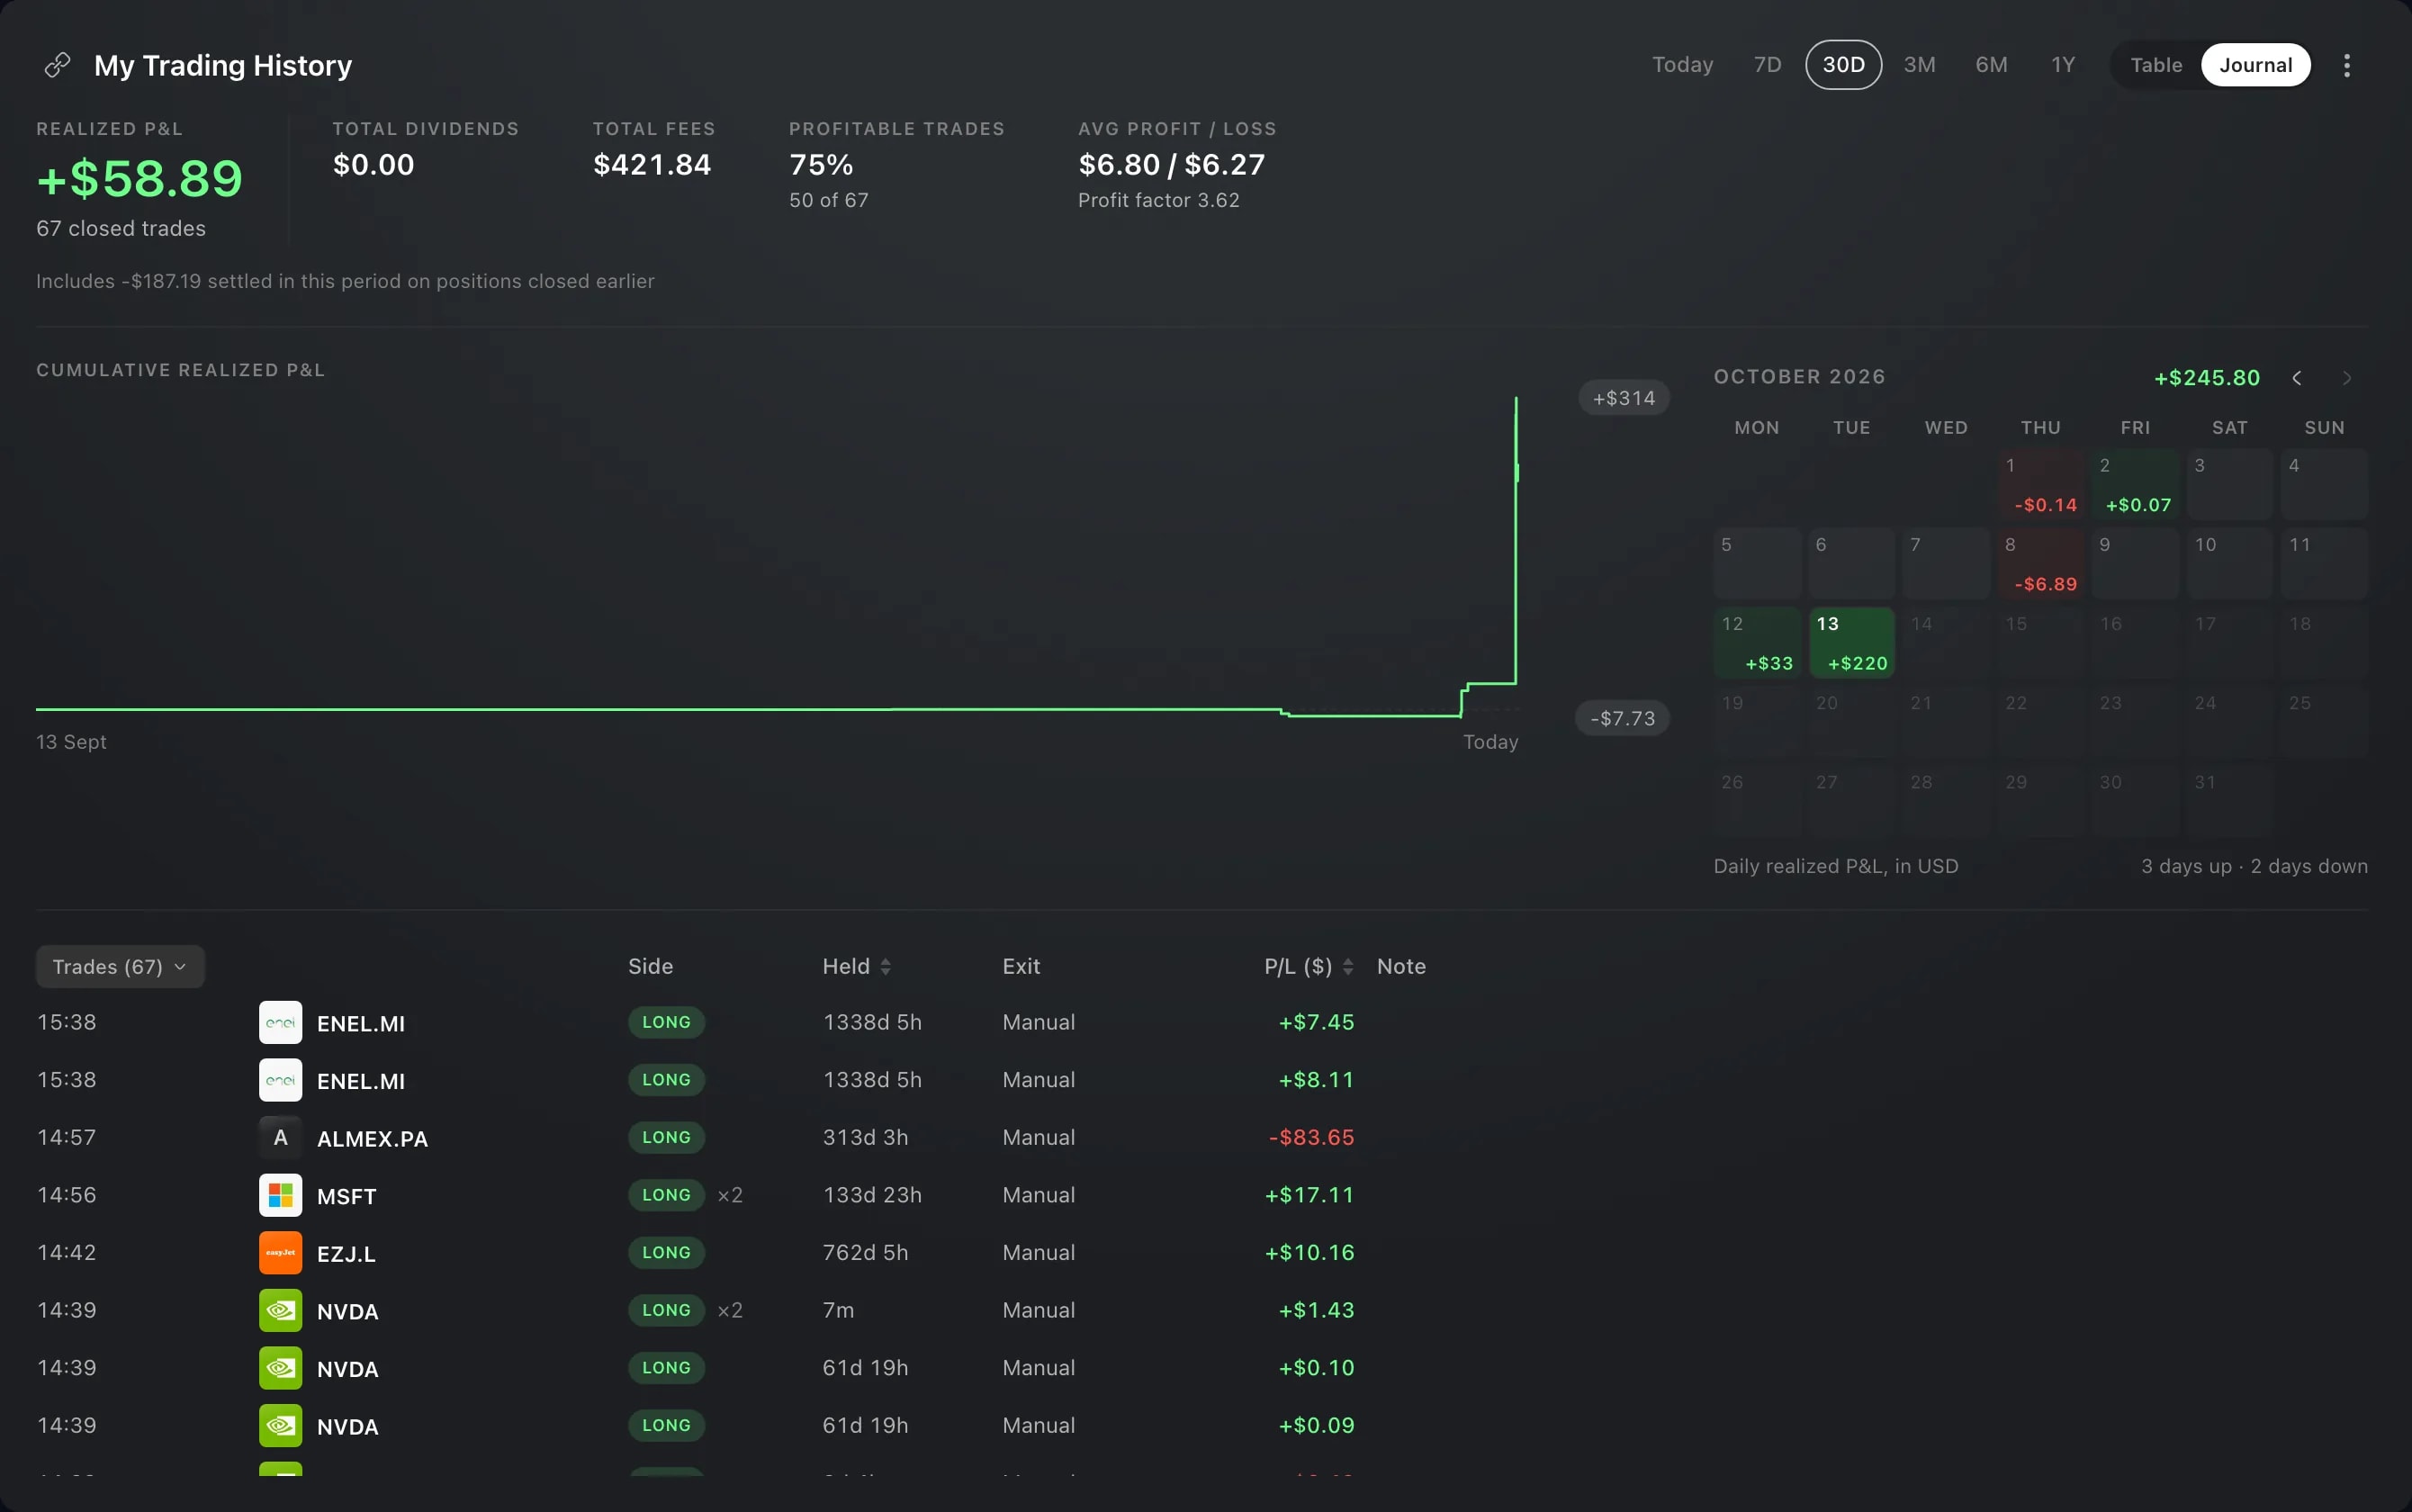
The Journal is a second view of your closed trades. Where the table lists them, the Journal reviews the period: its Realized P&L, how that built up day by day, and every trade with your own note on it. It is in the Trade History widget and in the History tab of My Portfolio.
It is made for looking back at how you traded: which days and which instruments the result came from, how often a trade ended in profit, and what you were thinking when you took it.
How to use it
In the header of the Trade History widget, which reads My Trading History, switch from Table to Journal. In My Portfolio, open the History tab first: the same switch is in the widget's header.
Read the period from the top. Realized P&L comes first, with the number of closed trades. Beside it are the period's dividends and fees, the share of profitable trades, and the average profit and loss with the profit factor.
Under the figures, the Cumulative realized P&L line shows how the result built up from the start of the period, and a calendar shows each day's result. Click a day to list only that day's trades. Click it again to list all of them.
The trades are listed with the newest close first. Click the title of the list, Trades, to group them by instrument, by day, by exit or by tag.
Click a trade to open it beside the list, with its dates, its rates and how it closed. Type a note, add tags and save. Only you can see your notes.
Good to know
The Journal reads the same period as the table. Choose it in the header, from today to the last 12 months.
A trade's result is its Realized P&L as etoro booked it.
The period's total can include an amount from positions that closed earlier and settled in this period. When it does, a line under the number says how much.
Click a column's header to sort the list by result or, in a wide widget, by the time a trade was held.
A small widget shows less of the Journal: the result and its curve at first, then the figures and the trades, and the charts once the widget is large. In a narrow widget, the switch is in the widget's menu, under View.
Screens are from a Demo account. The instruments and prices in them are illustrative.