Layouts
New ready-made layouts
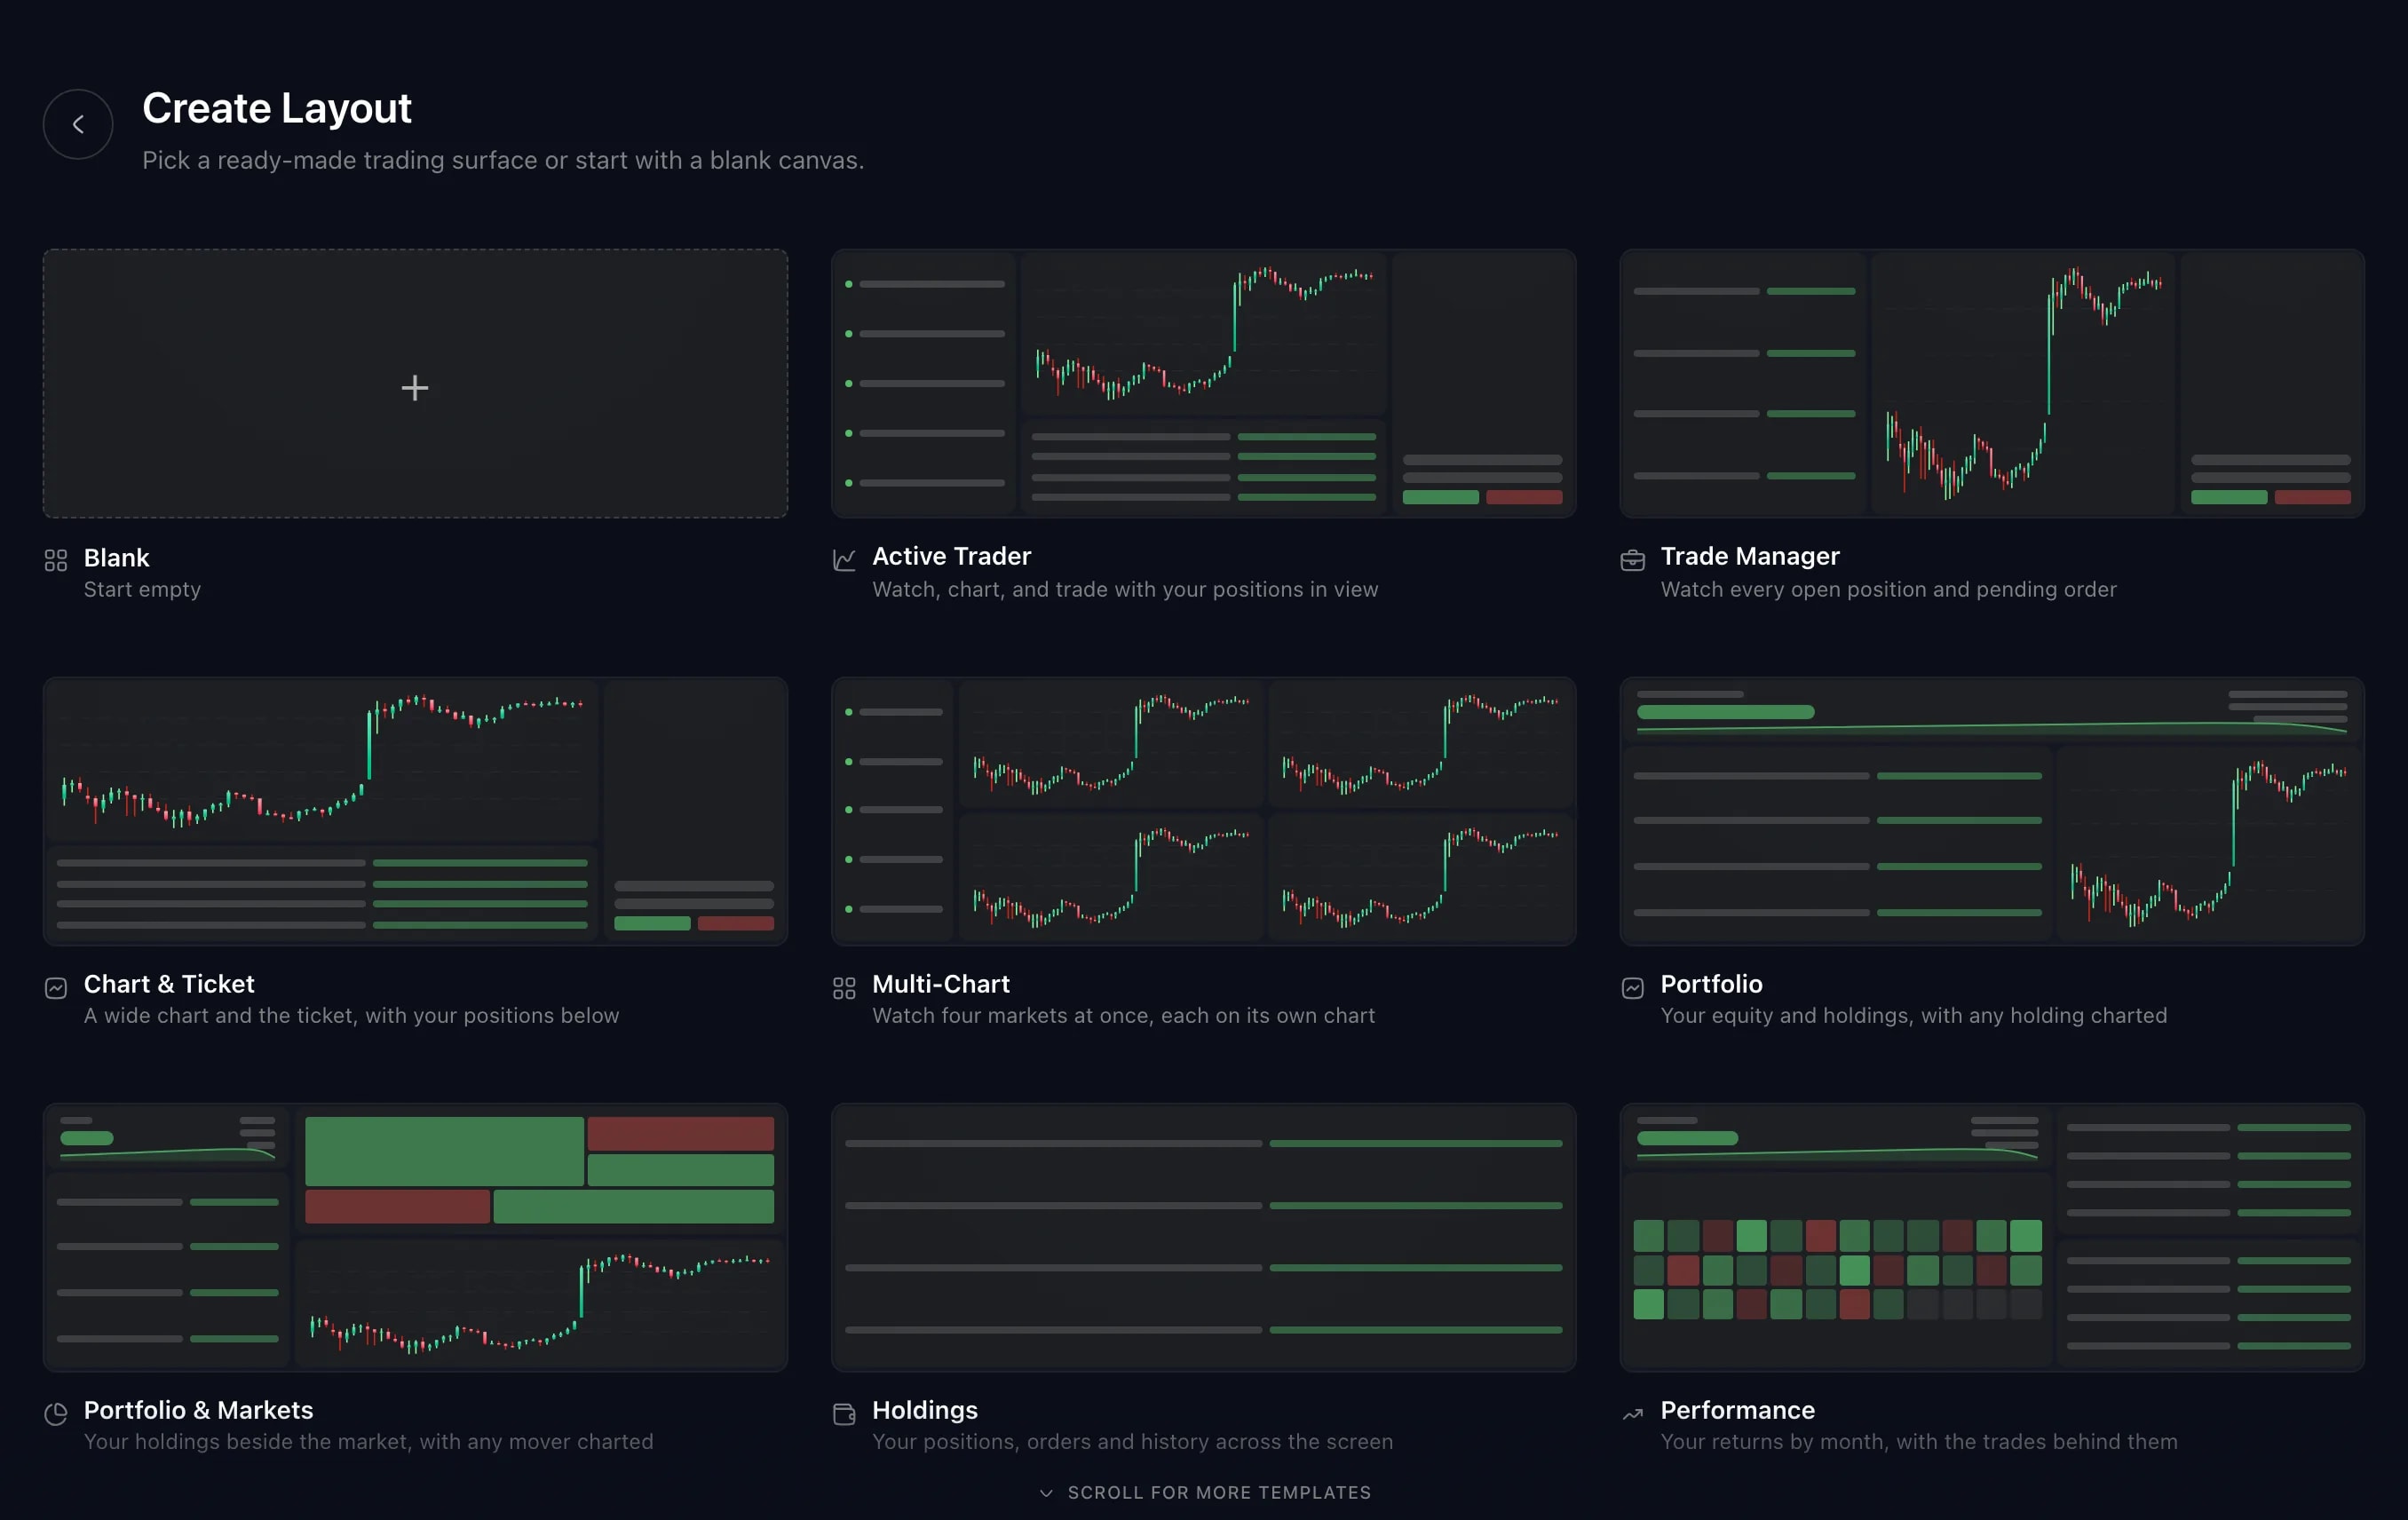
Create Layout has more ready-made layouts, each arranged and linked for one job, from scanning the market to reading one market on two timeframes.
What it is
A layout is a set of widgets arranged for one job and already linked, so that they follow the same instrument. Create Layout now offers more of them ready-made. You start from an arrangement that fits the task and change it from there.
Market Overview starts from the whole market: a heatmap of US large caps, today's gainers in a screener, the week's events, and a chart of whatever you click. Heatmap gives that heatmap the whole screen. Portfolio & Markets puts your account and your holdings beside it, so you see how the market around them is moving.
Scanner pairs a screener with a chart and a watchlist: filter the market, chart a result, and keep the names worth following. Multi-Timeframe shows one market on a daily and an hourly chart that follow the same instrument.
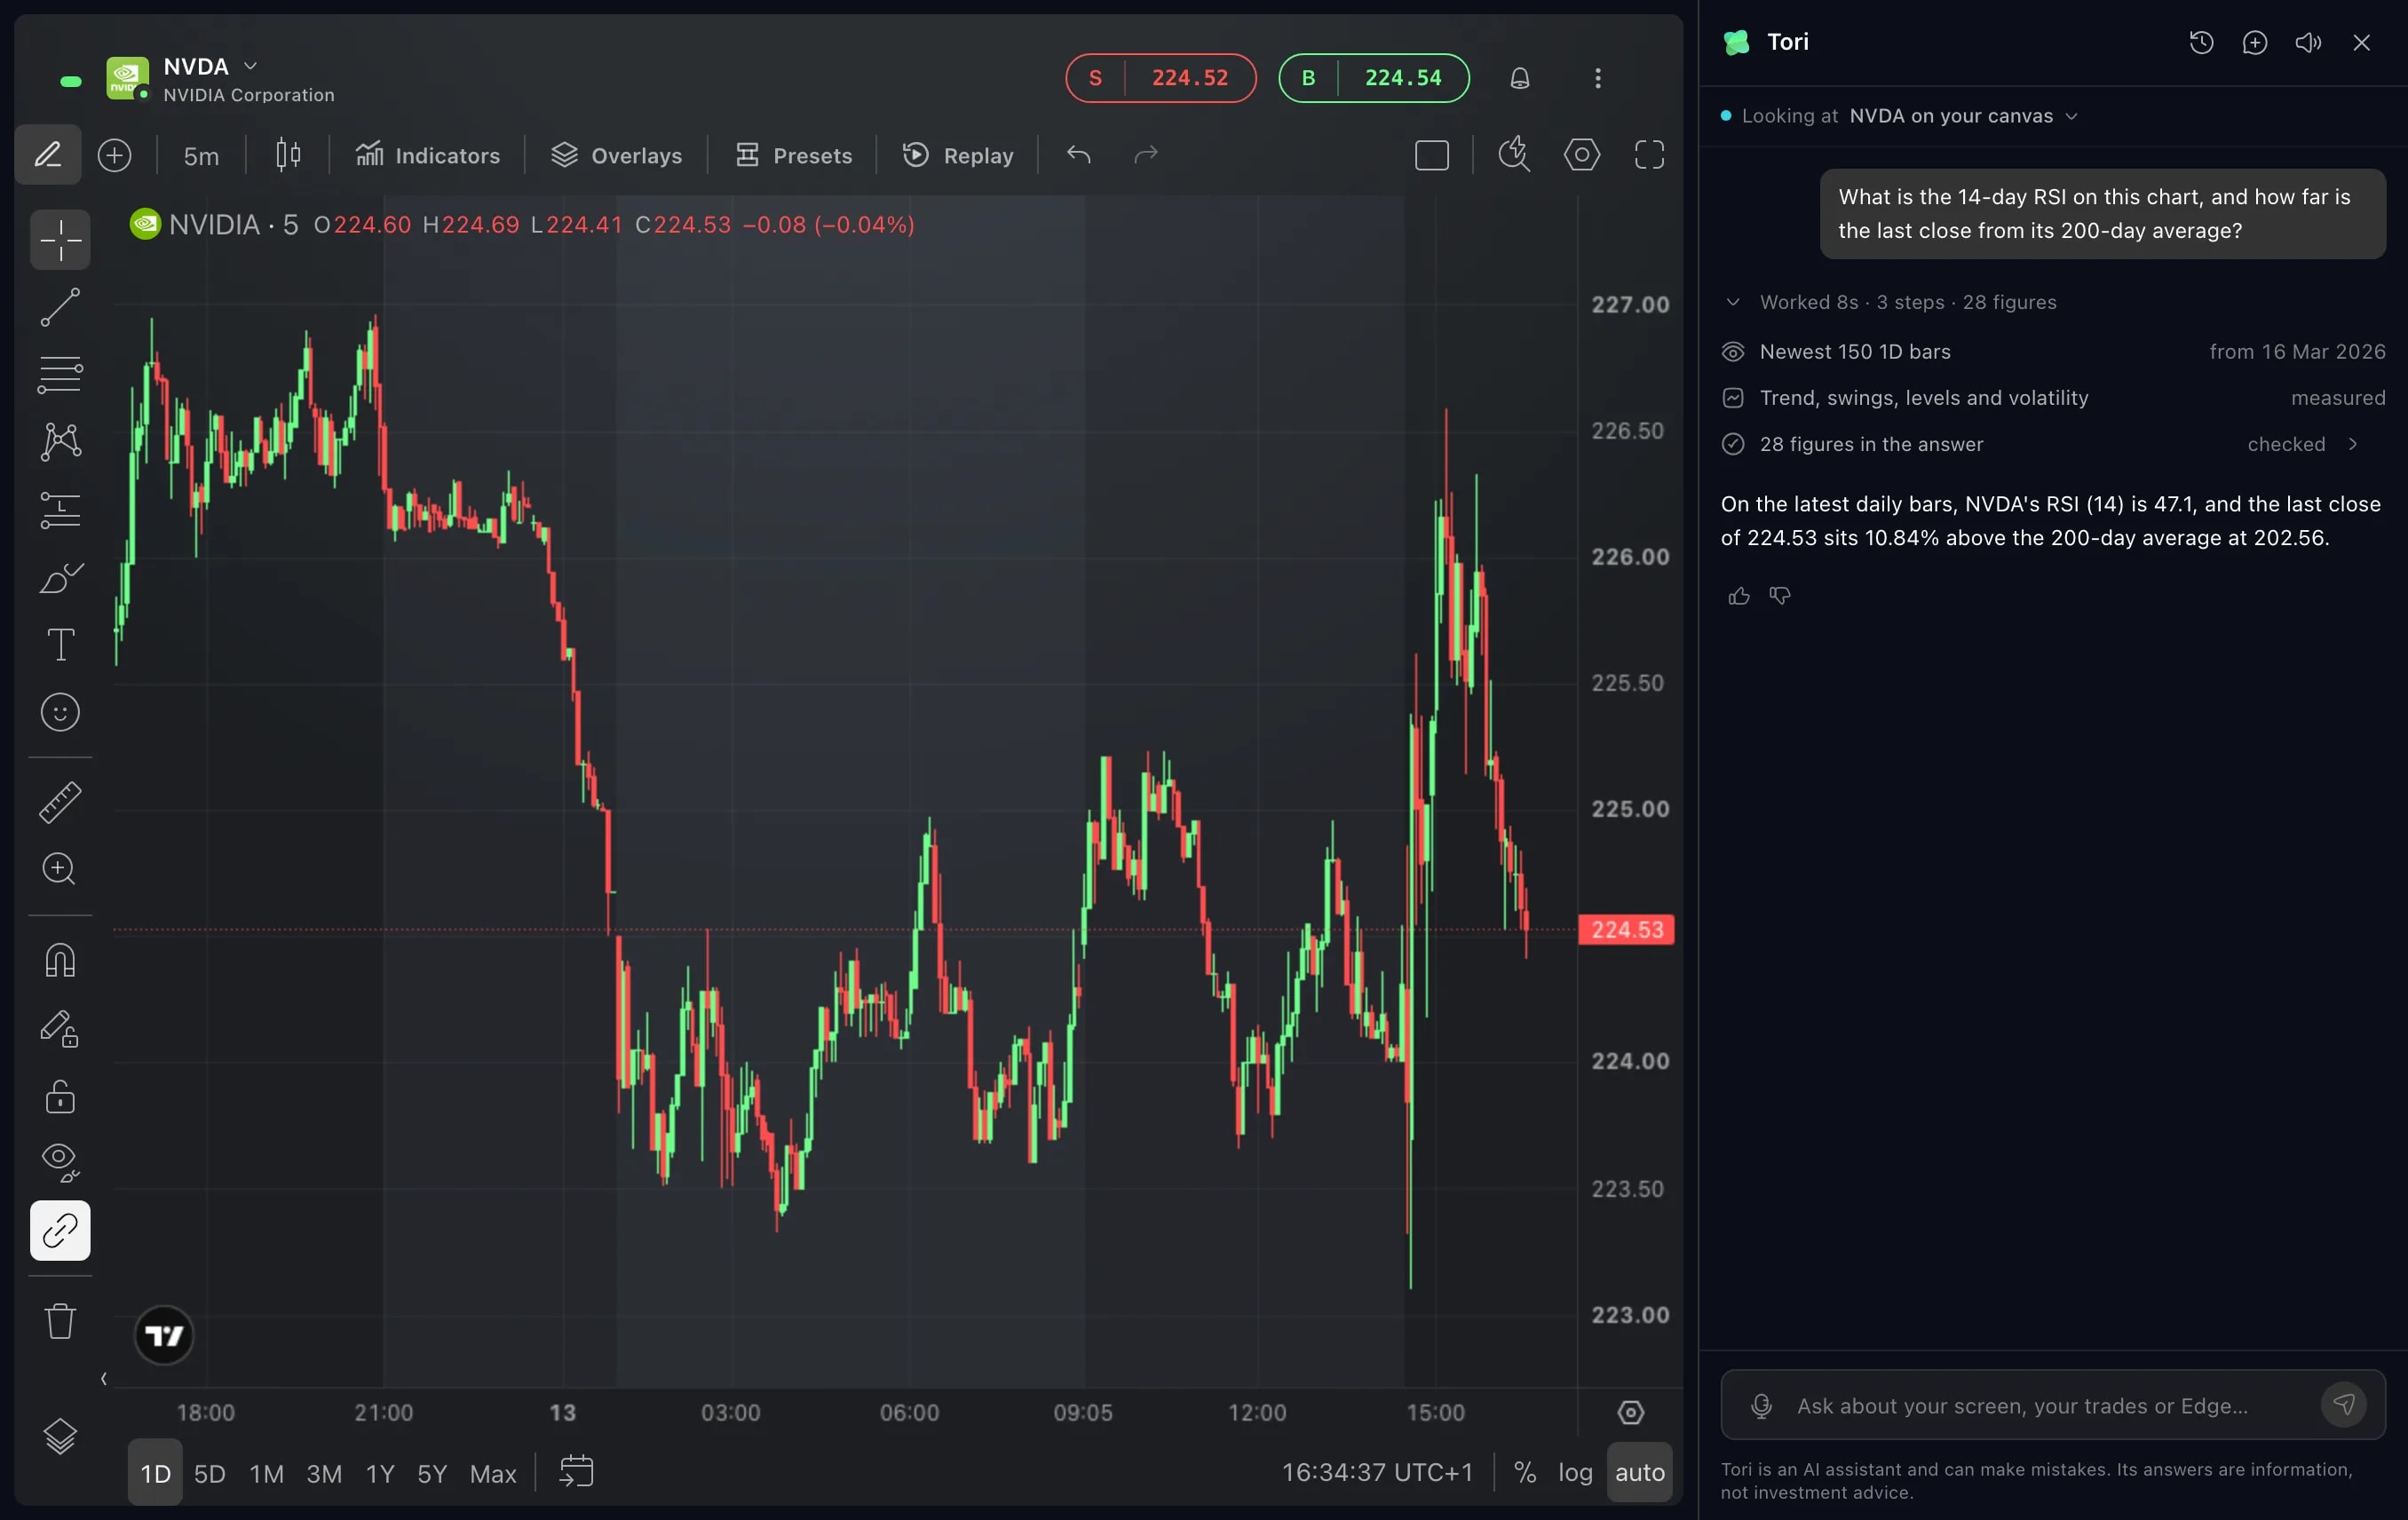
Active Trader changed as well. A new Active Trader layout shows your positions under the chart, where News used to be.
How to use it
Click the + button in the sidebar and choose Add layout. You can also open the command palette and choose Create Layout.
Pick a layout. Each card names the layout and says what it is for, and the page scrolls to show the rest. Blank starts with an empty canvas.
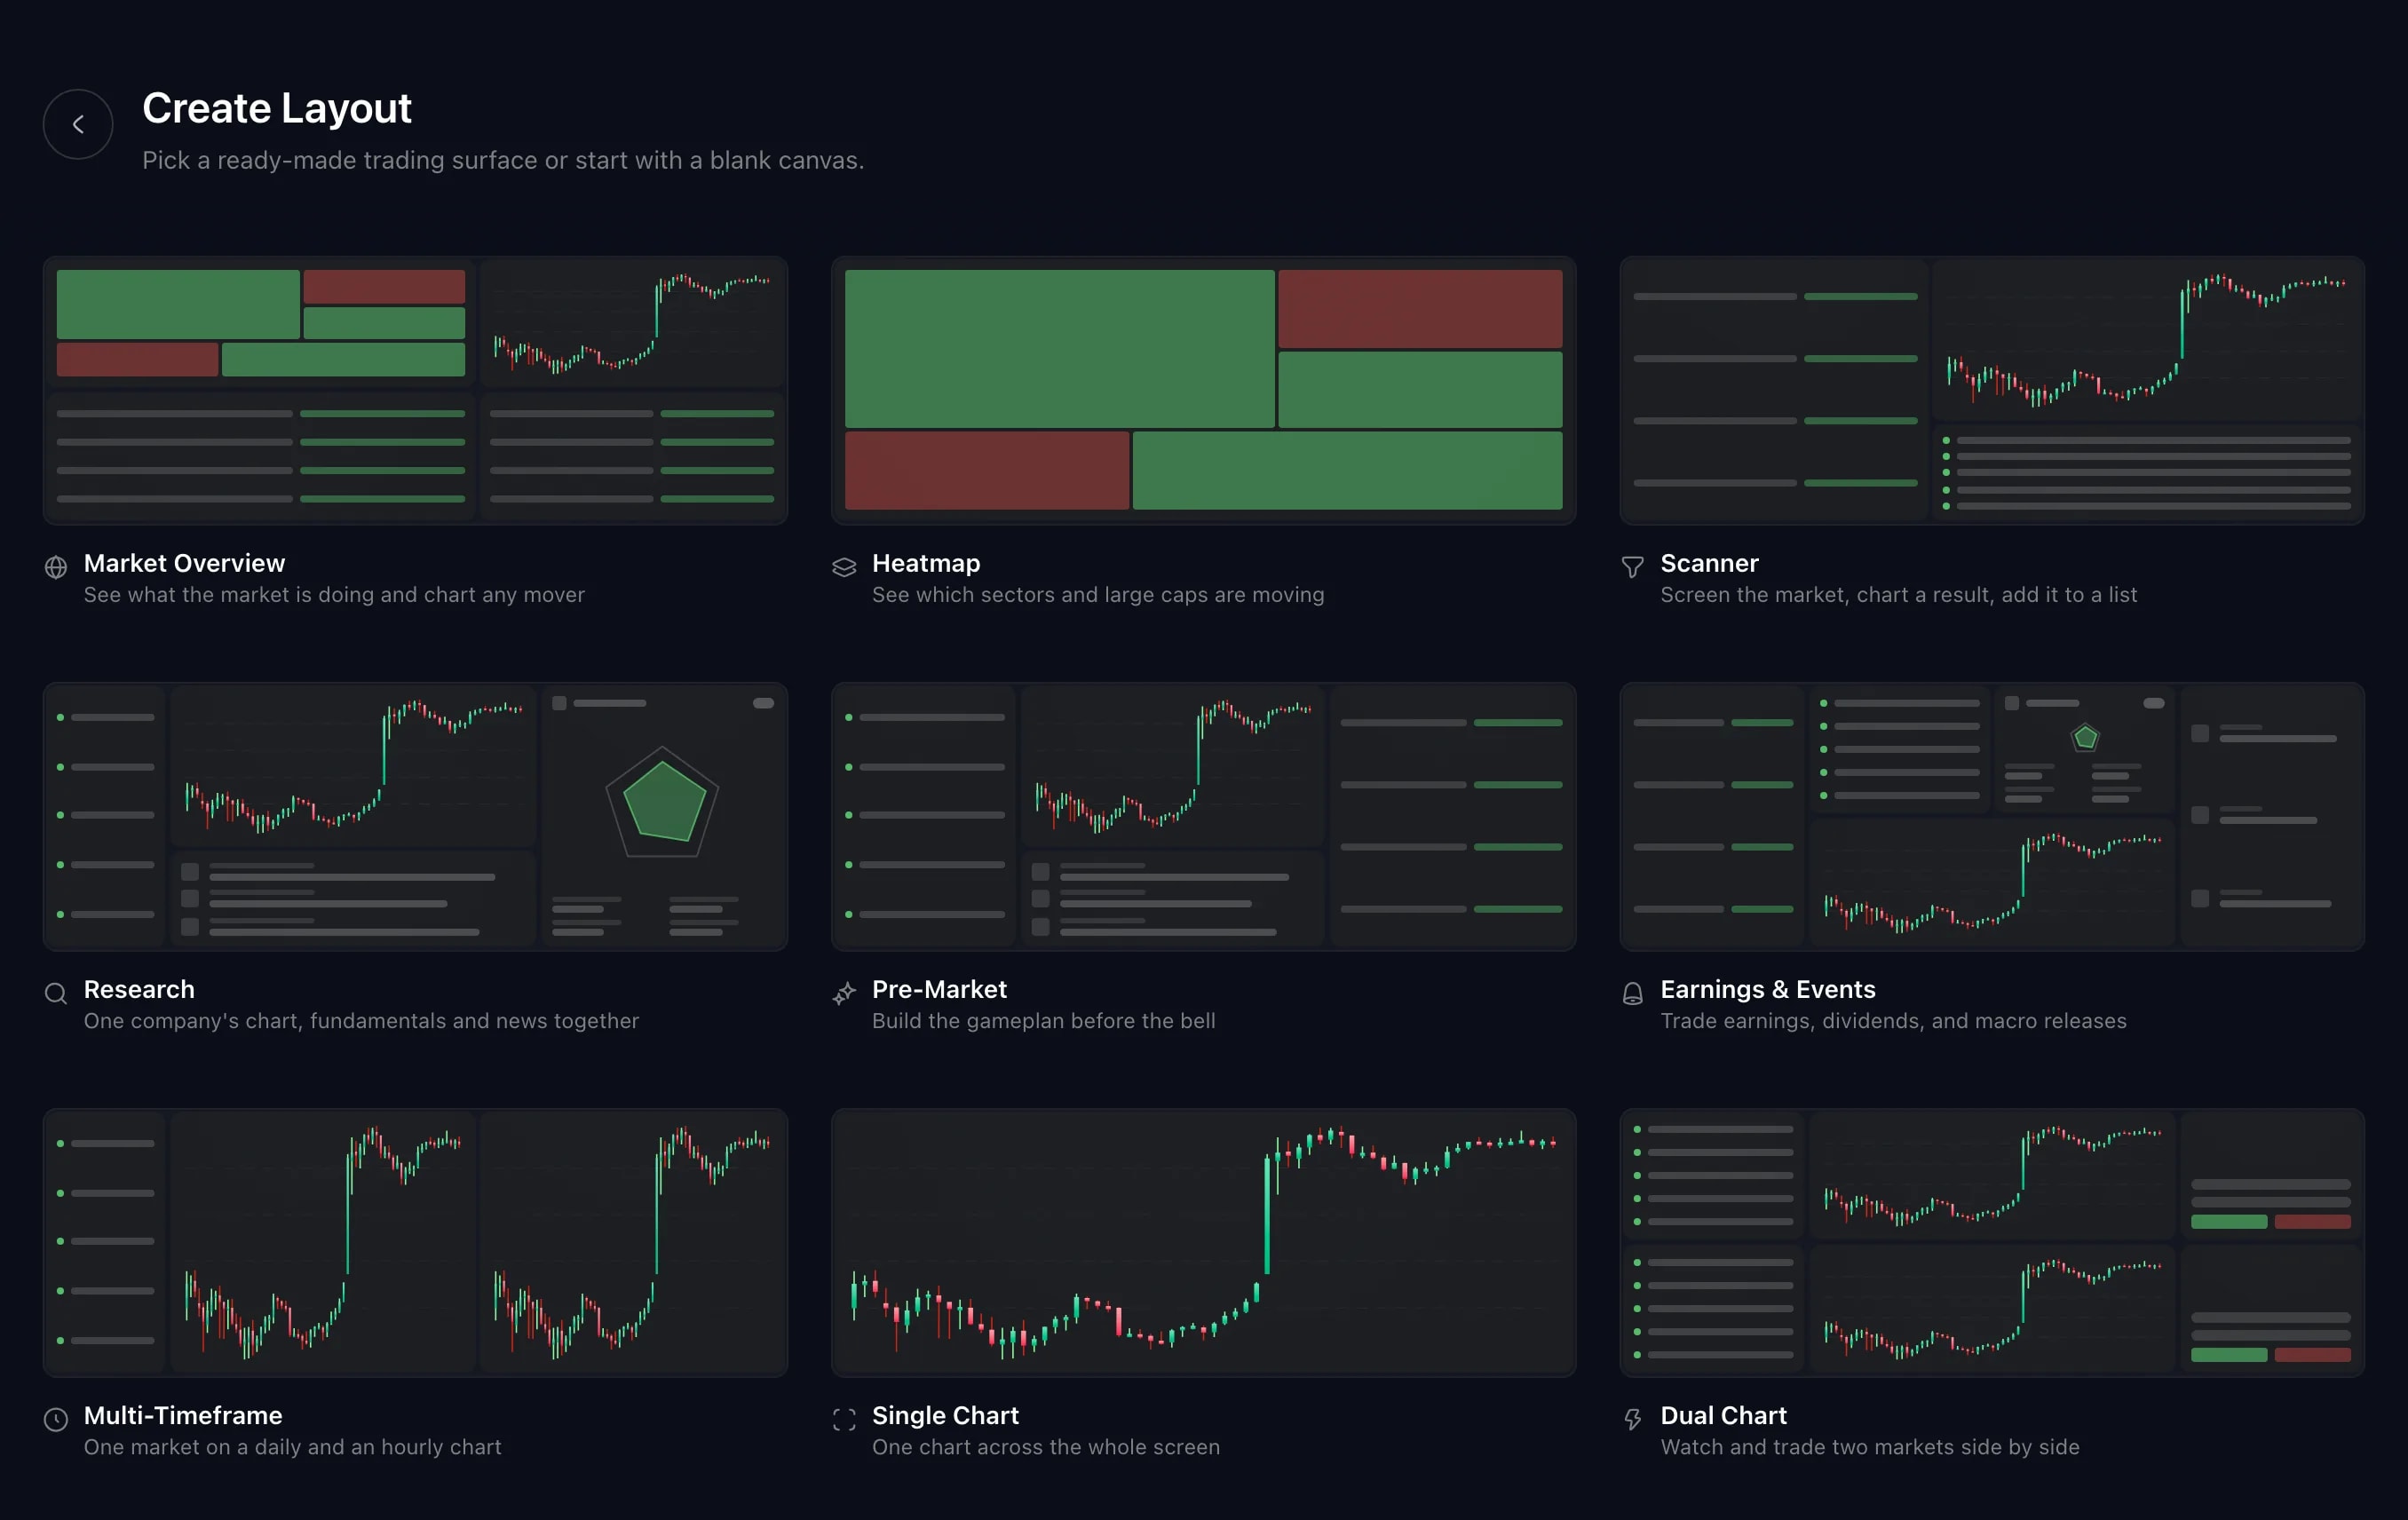
The layout opens and joins your other layouts in the sidebar, with its widgets already linked. Click a row, a heatmap tile or a holding in one widget, and the chart beside it follows.
Make it yours. Add, remove, move and resize widgets as in any other layout. The changes are saved with the layout and follow you to your other devices.
Good to know
Layouts you already have stay as they are. An Active Trader layout created before October 2026 keeps News under its chart unless you change it.
To rebuild a layout from the current version of its template, open the command palette, choose Manage layouts, then open the layout’s options and choose Reset to Defaults.
In Market Overview the events list is not linked to the chart. It keeps listing earnings, dividends and macro releases for popular stocks, whatever you chart.
In Heatmap the heatmap sits in a link group, so a Chart or an Order Ticket you add later follows the tile you click.
Screens are from a Demo account. The instruments and prices in them are illustrative.