Charts
Replay the chart
Play back any instrument's price history bar by bar, from the moment you choose and at the speed you choose.
What it is
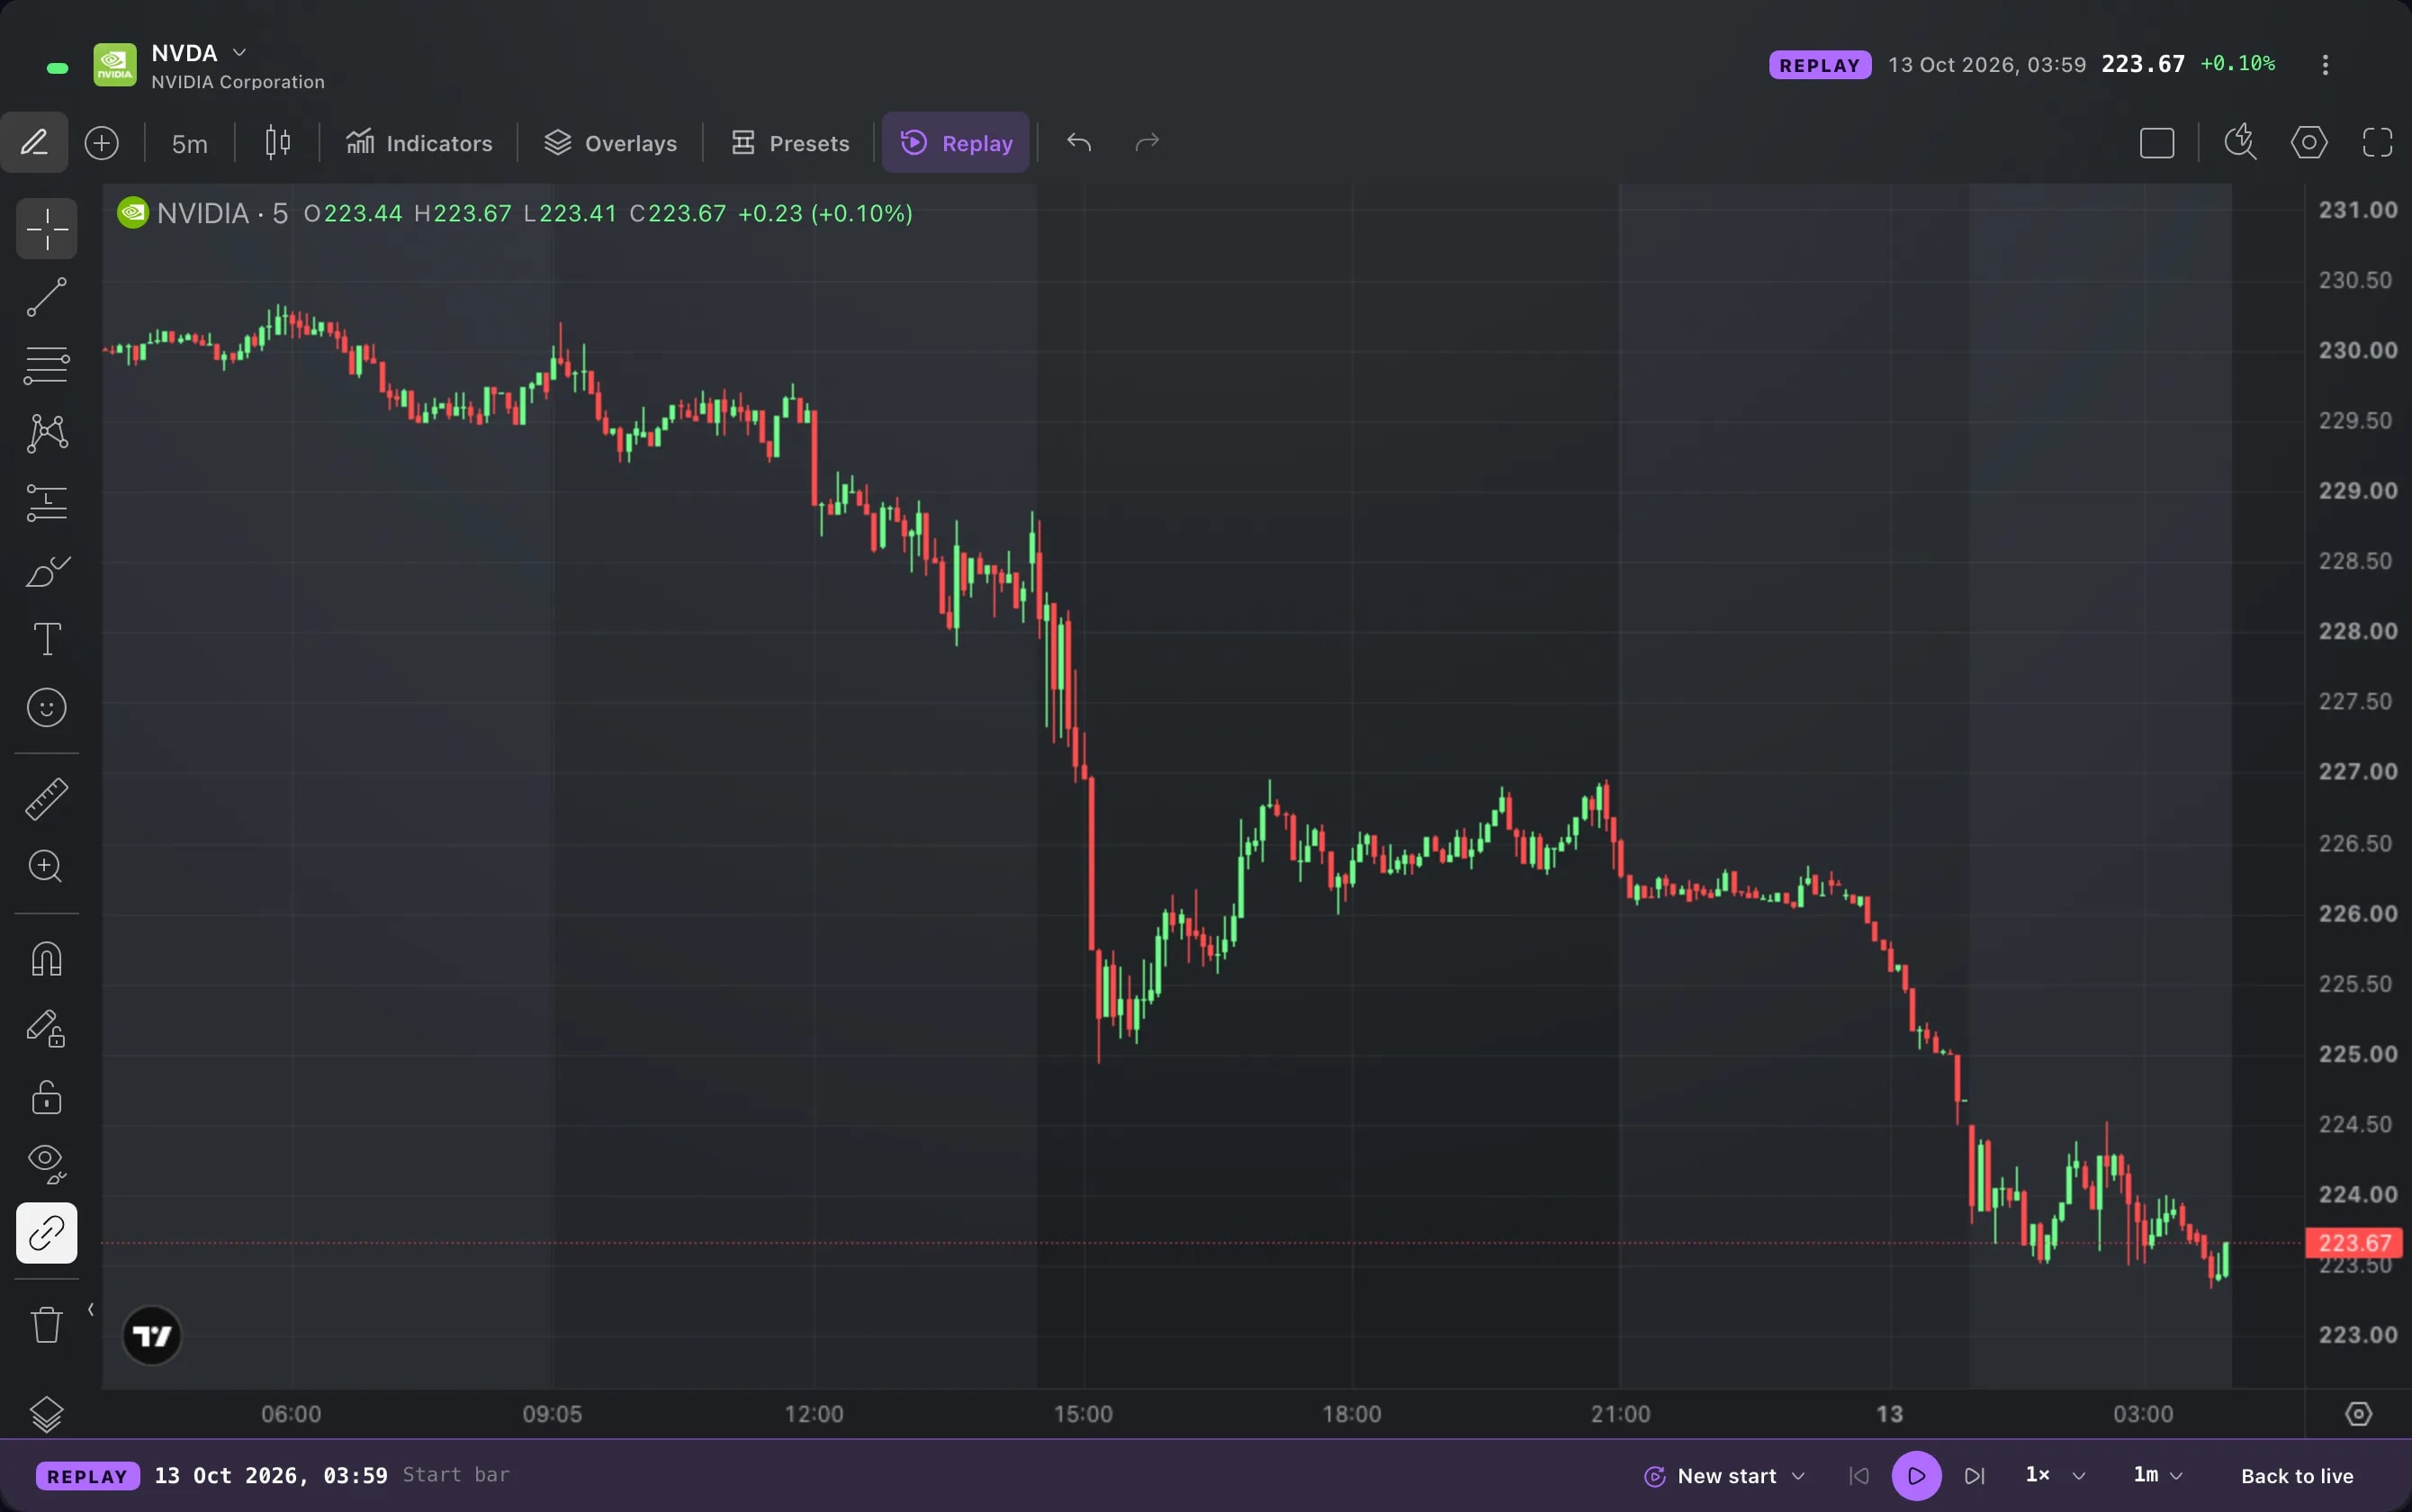
Replay plays a chart's history back, one bar at a time. You pick a moment in the past, and the chart shows only what had happened by then. Every later candle stays hidden until you step or play forward.
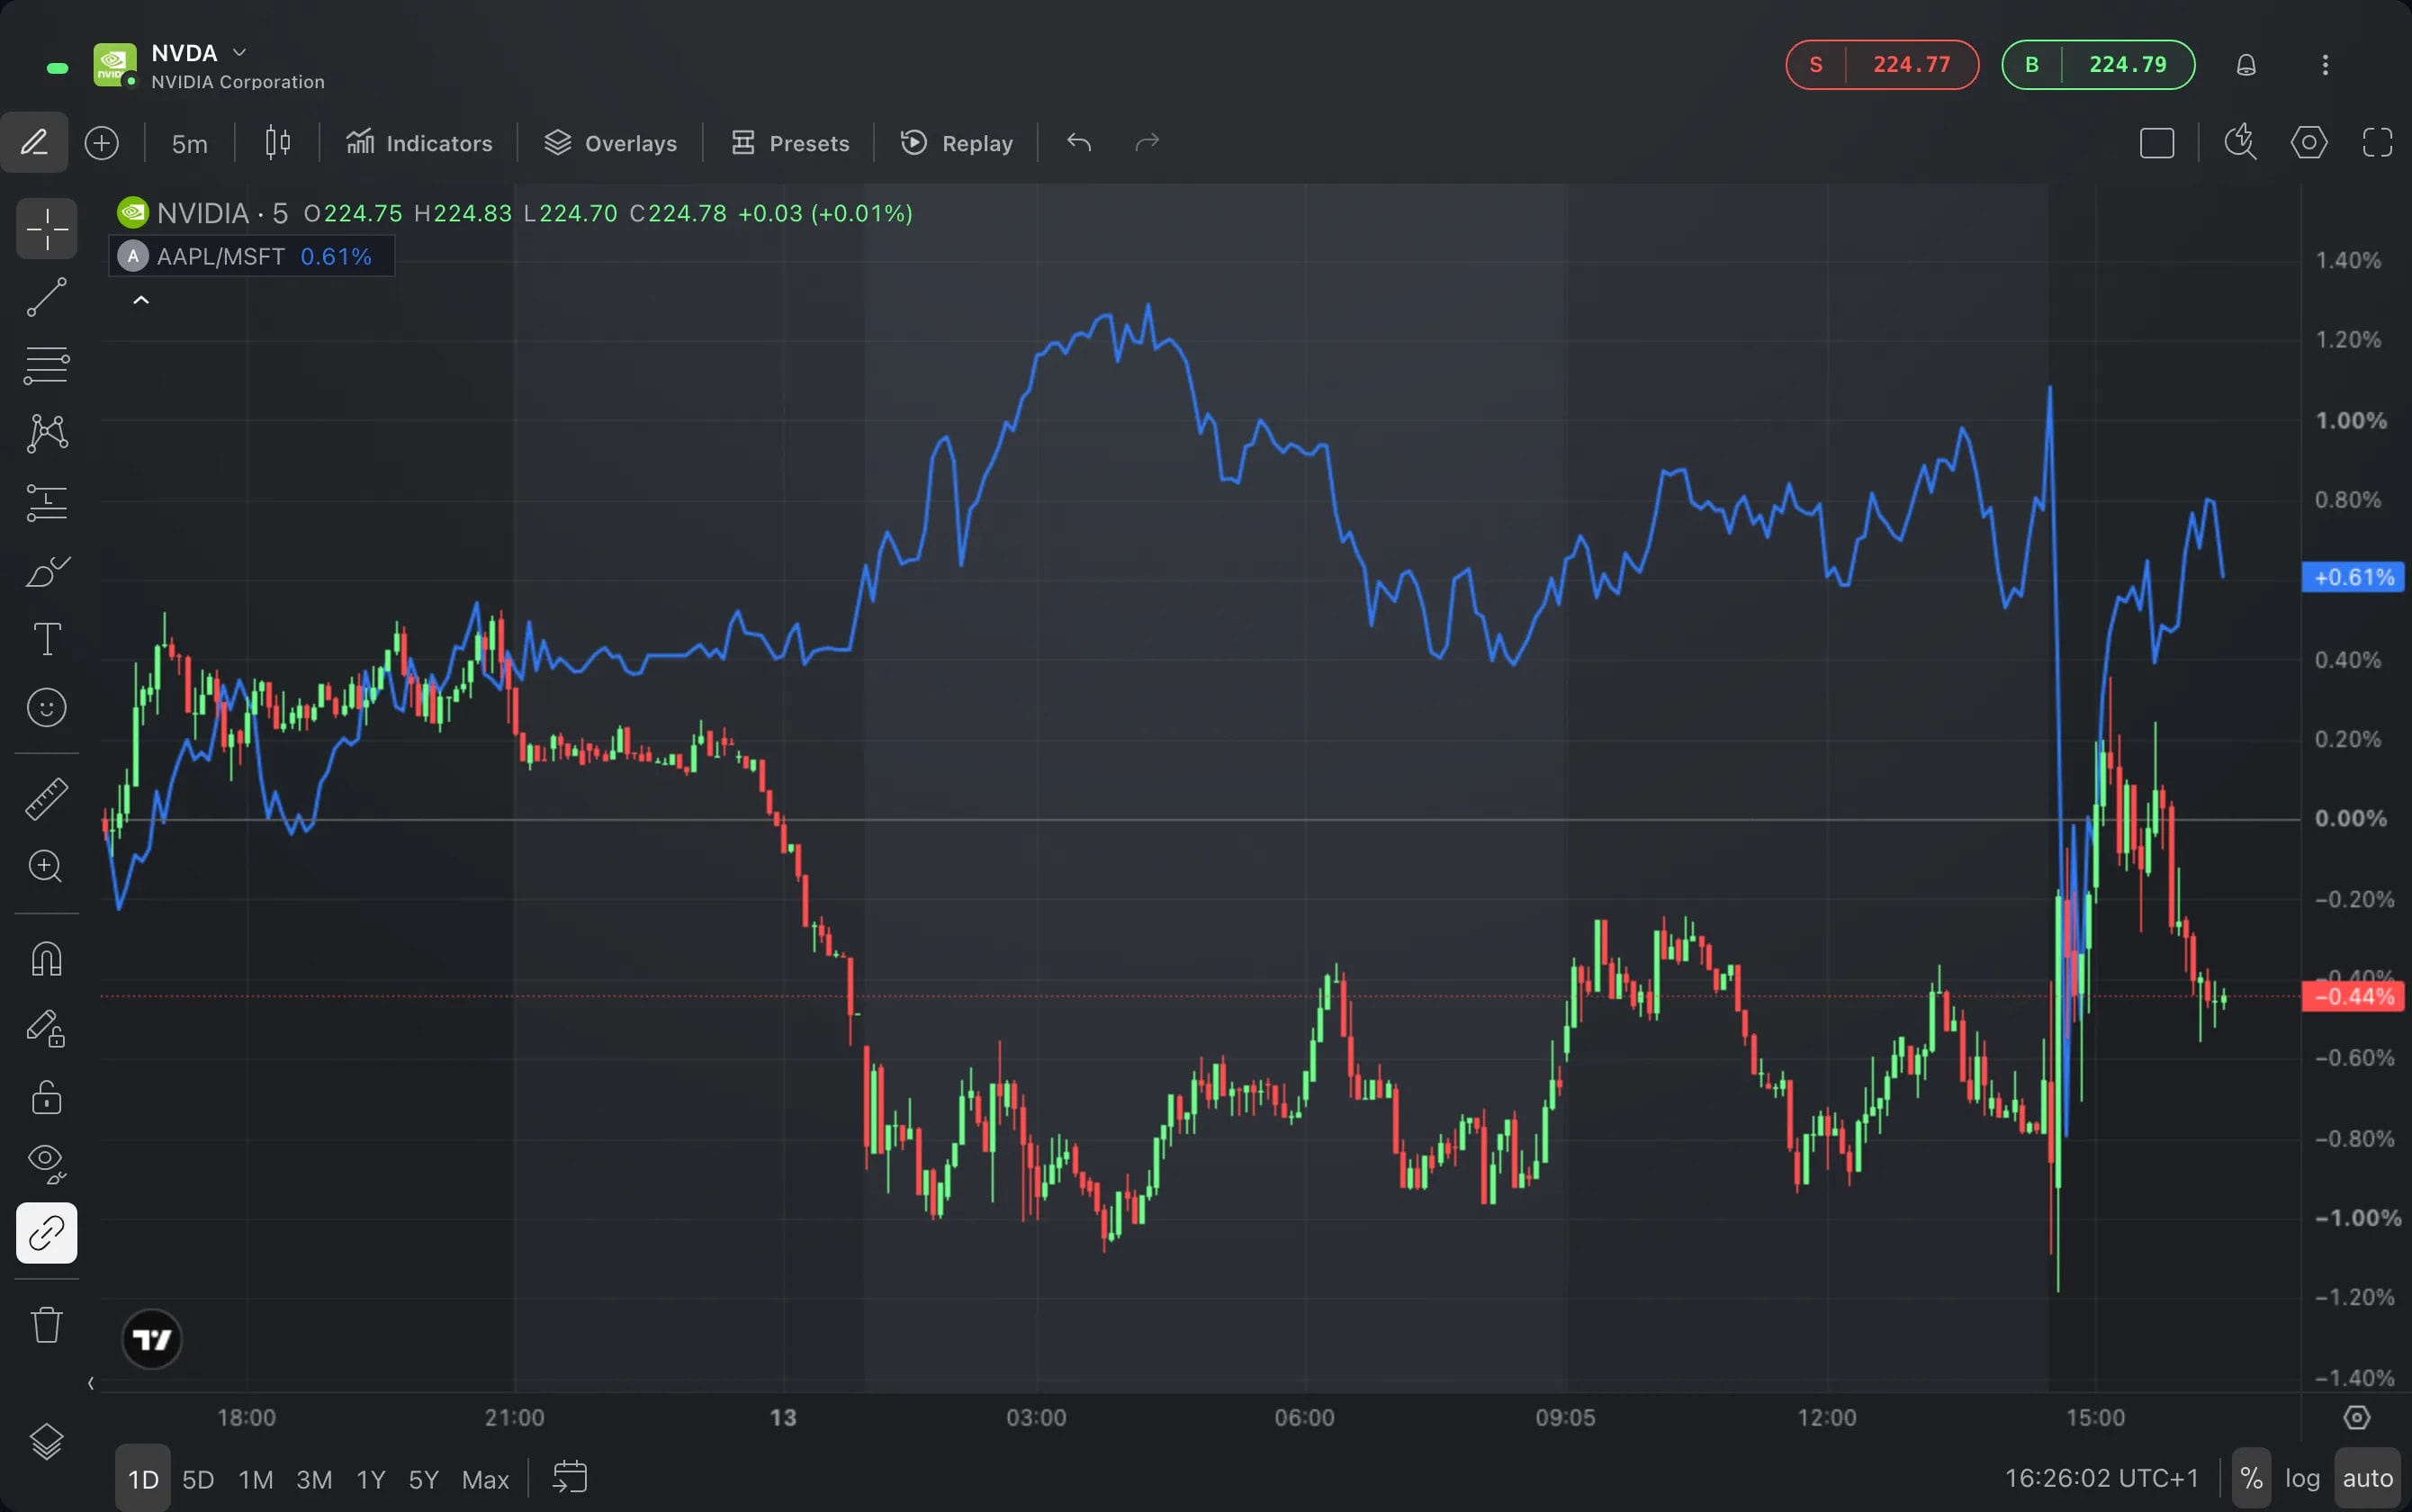
It is a way to watch a move unfold again and to practise reading price action on the chart you use every day. Indicators, Compare symbols and news markers follow the replay, so they also stop at the replay time.
Replay is on the Chart widget of any instrument. The chart of a person or of a Smart Portfolio does not have it.
How to use it
Choose Replay in the toolbar at the top of the chart. A strip appears under the chart and asks where the replay starts.
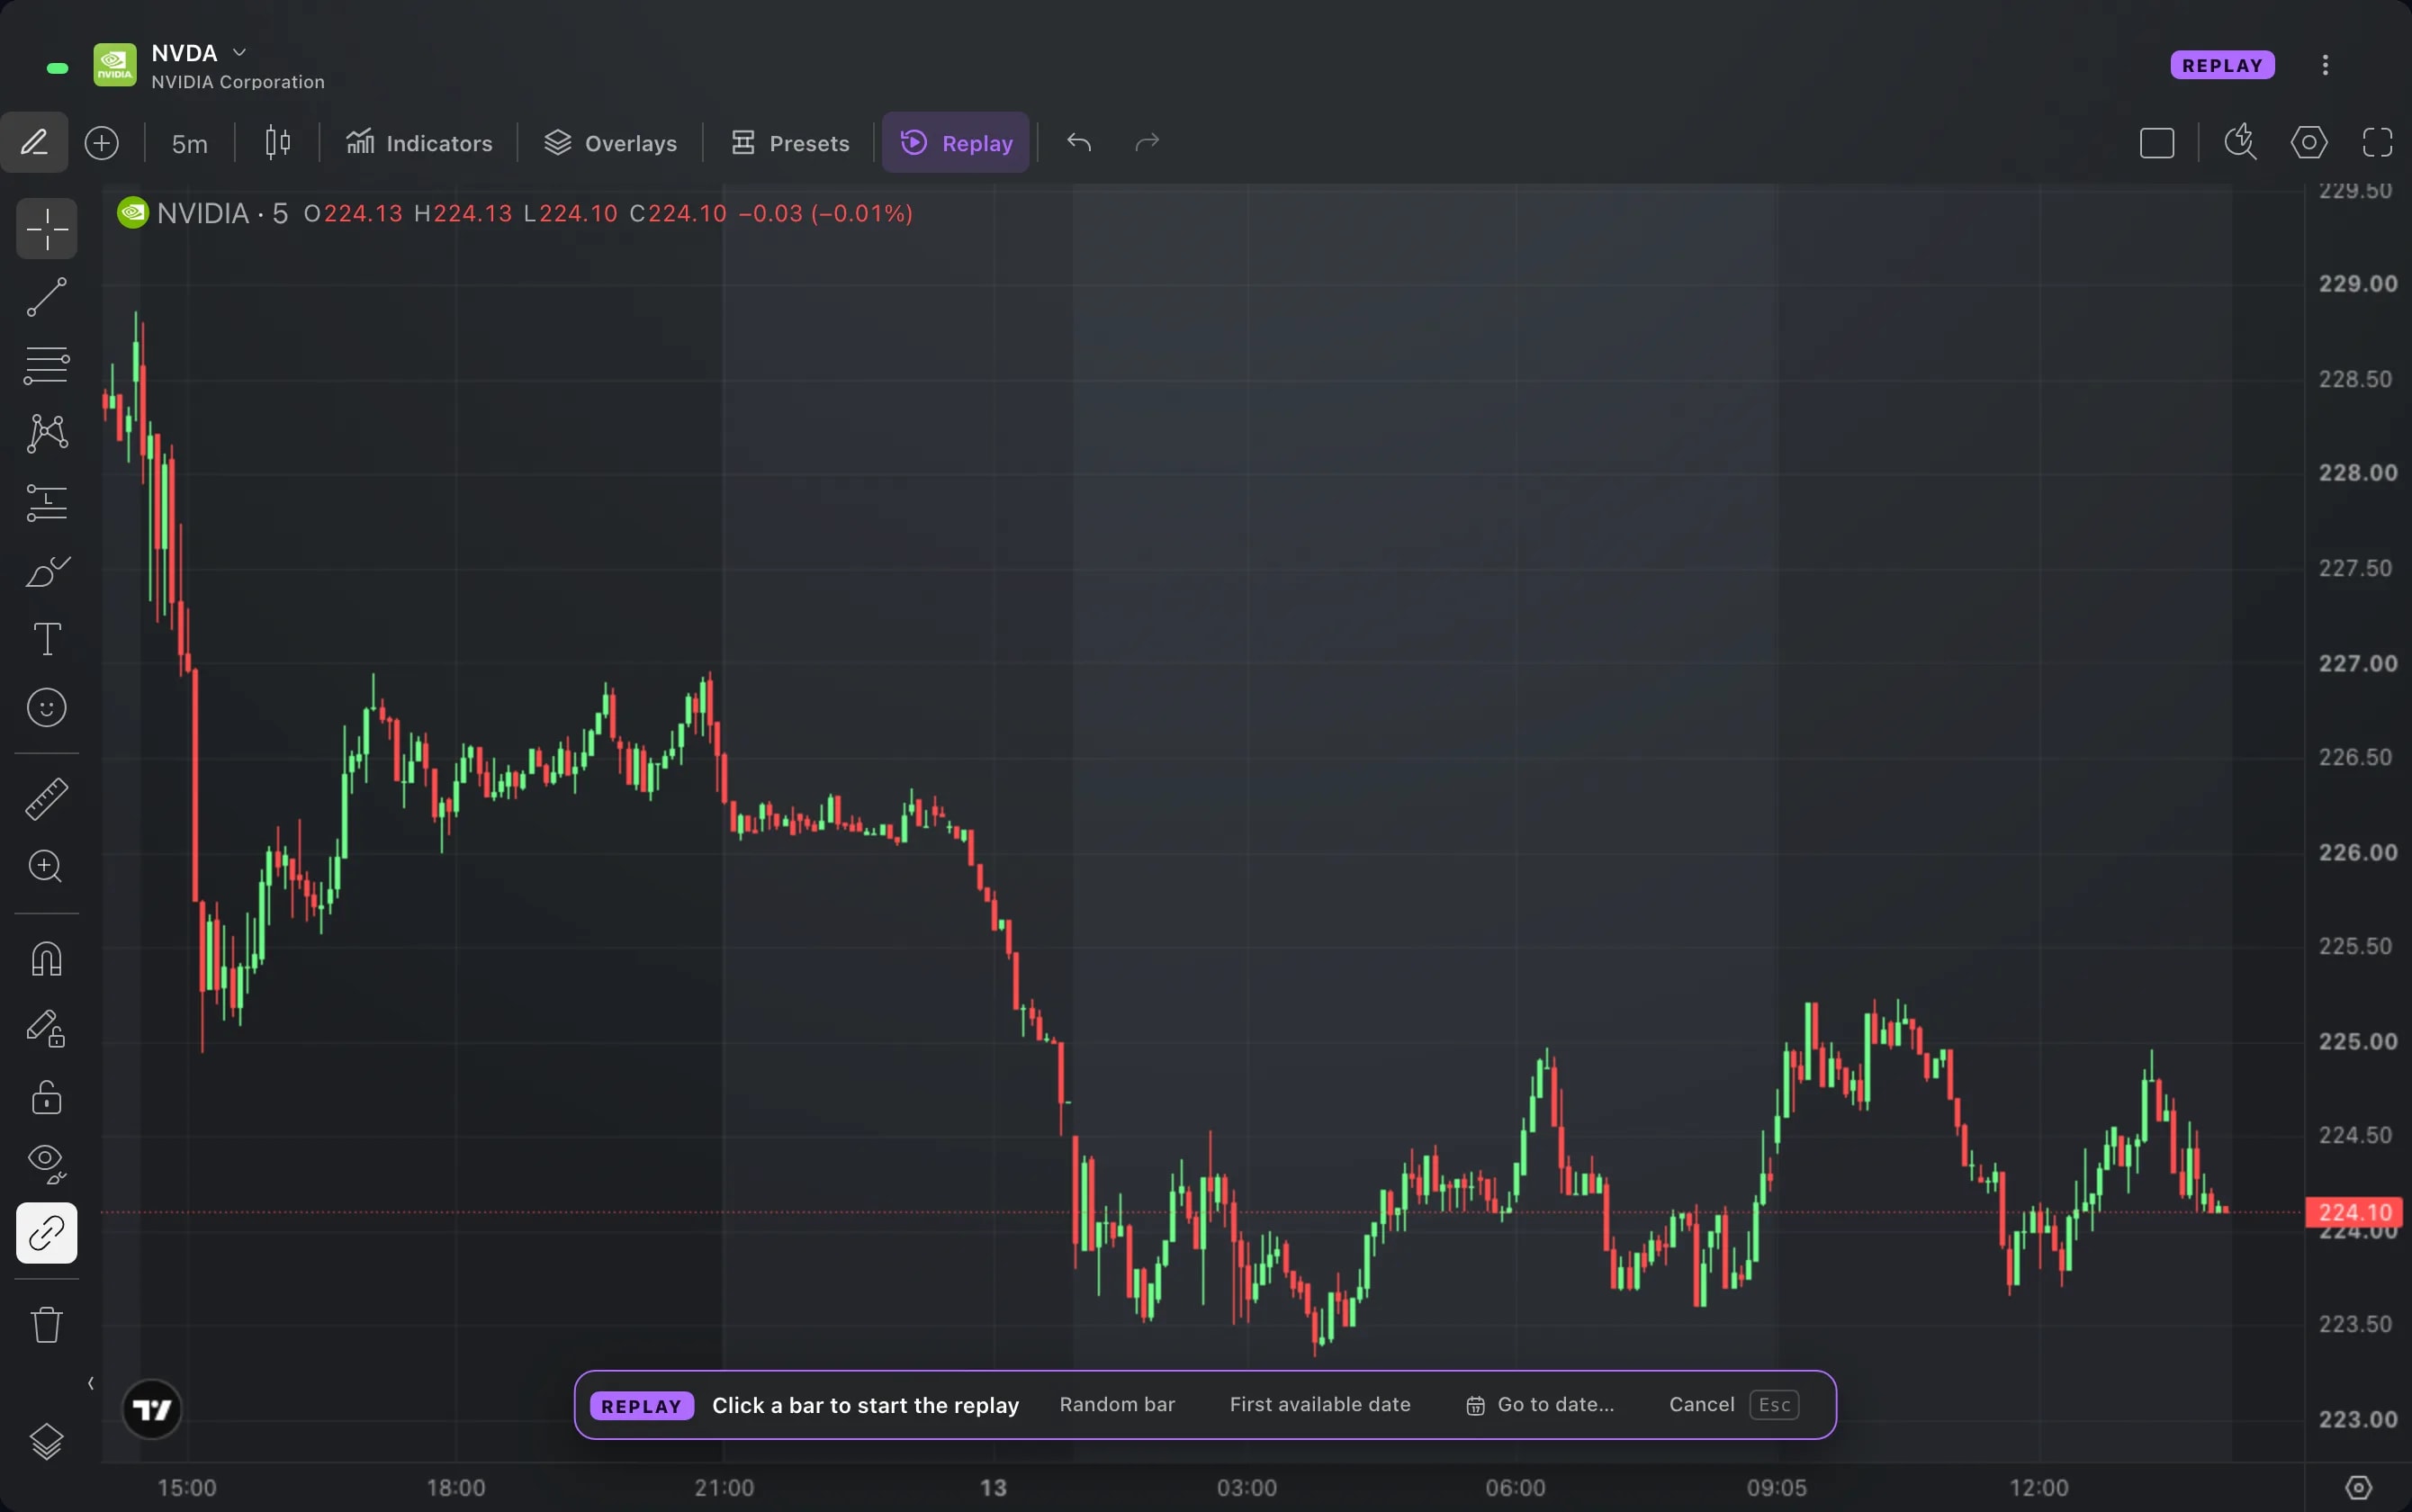
Click a bar on the chart to start there. The bars after the pointer dim, so you see what the replay will hide. You can also choose Random bar, First available date or Go to date…, which takes a day and a time.
Use the Replay bar under the chart to play or pause, to step one bar back or forward, and to set the speed from 0.5 to 10 steps a second. From the keyboard, Shift+→ steps forward, Shift+← steps back and Shift+↓ plays or pauses.
Open the interval menu on the Replay bar to choose how the newest candle forms. Auto builds it from a finer timeframe, so the candle grows as you watch. Whole bars adds one finished candle at a time.
Choose Back to live to end the replay and return to the current price. New start lets you pick another moment without leaving the replay.
Good to know
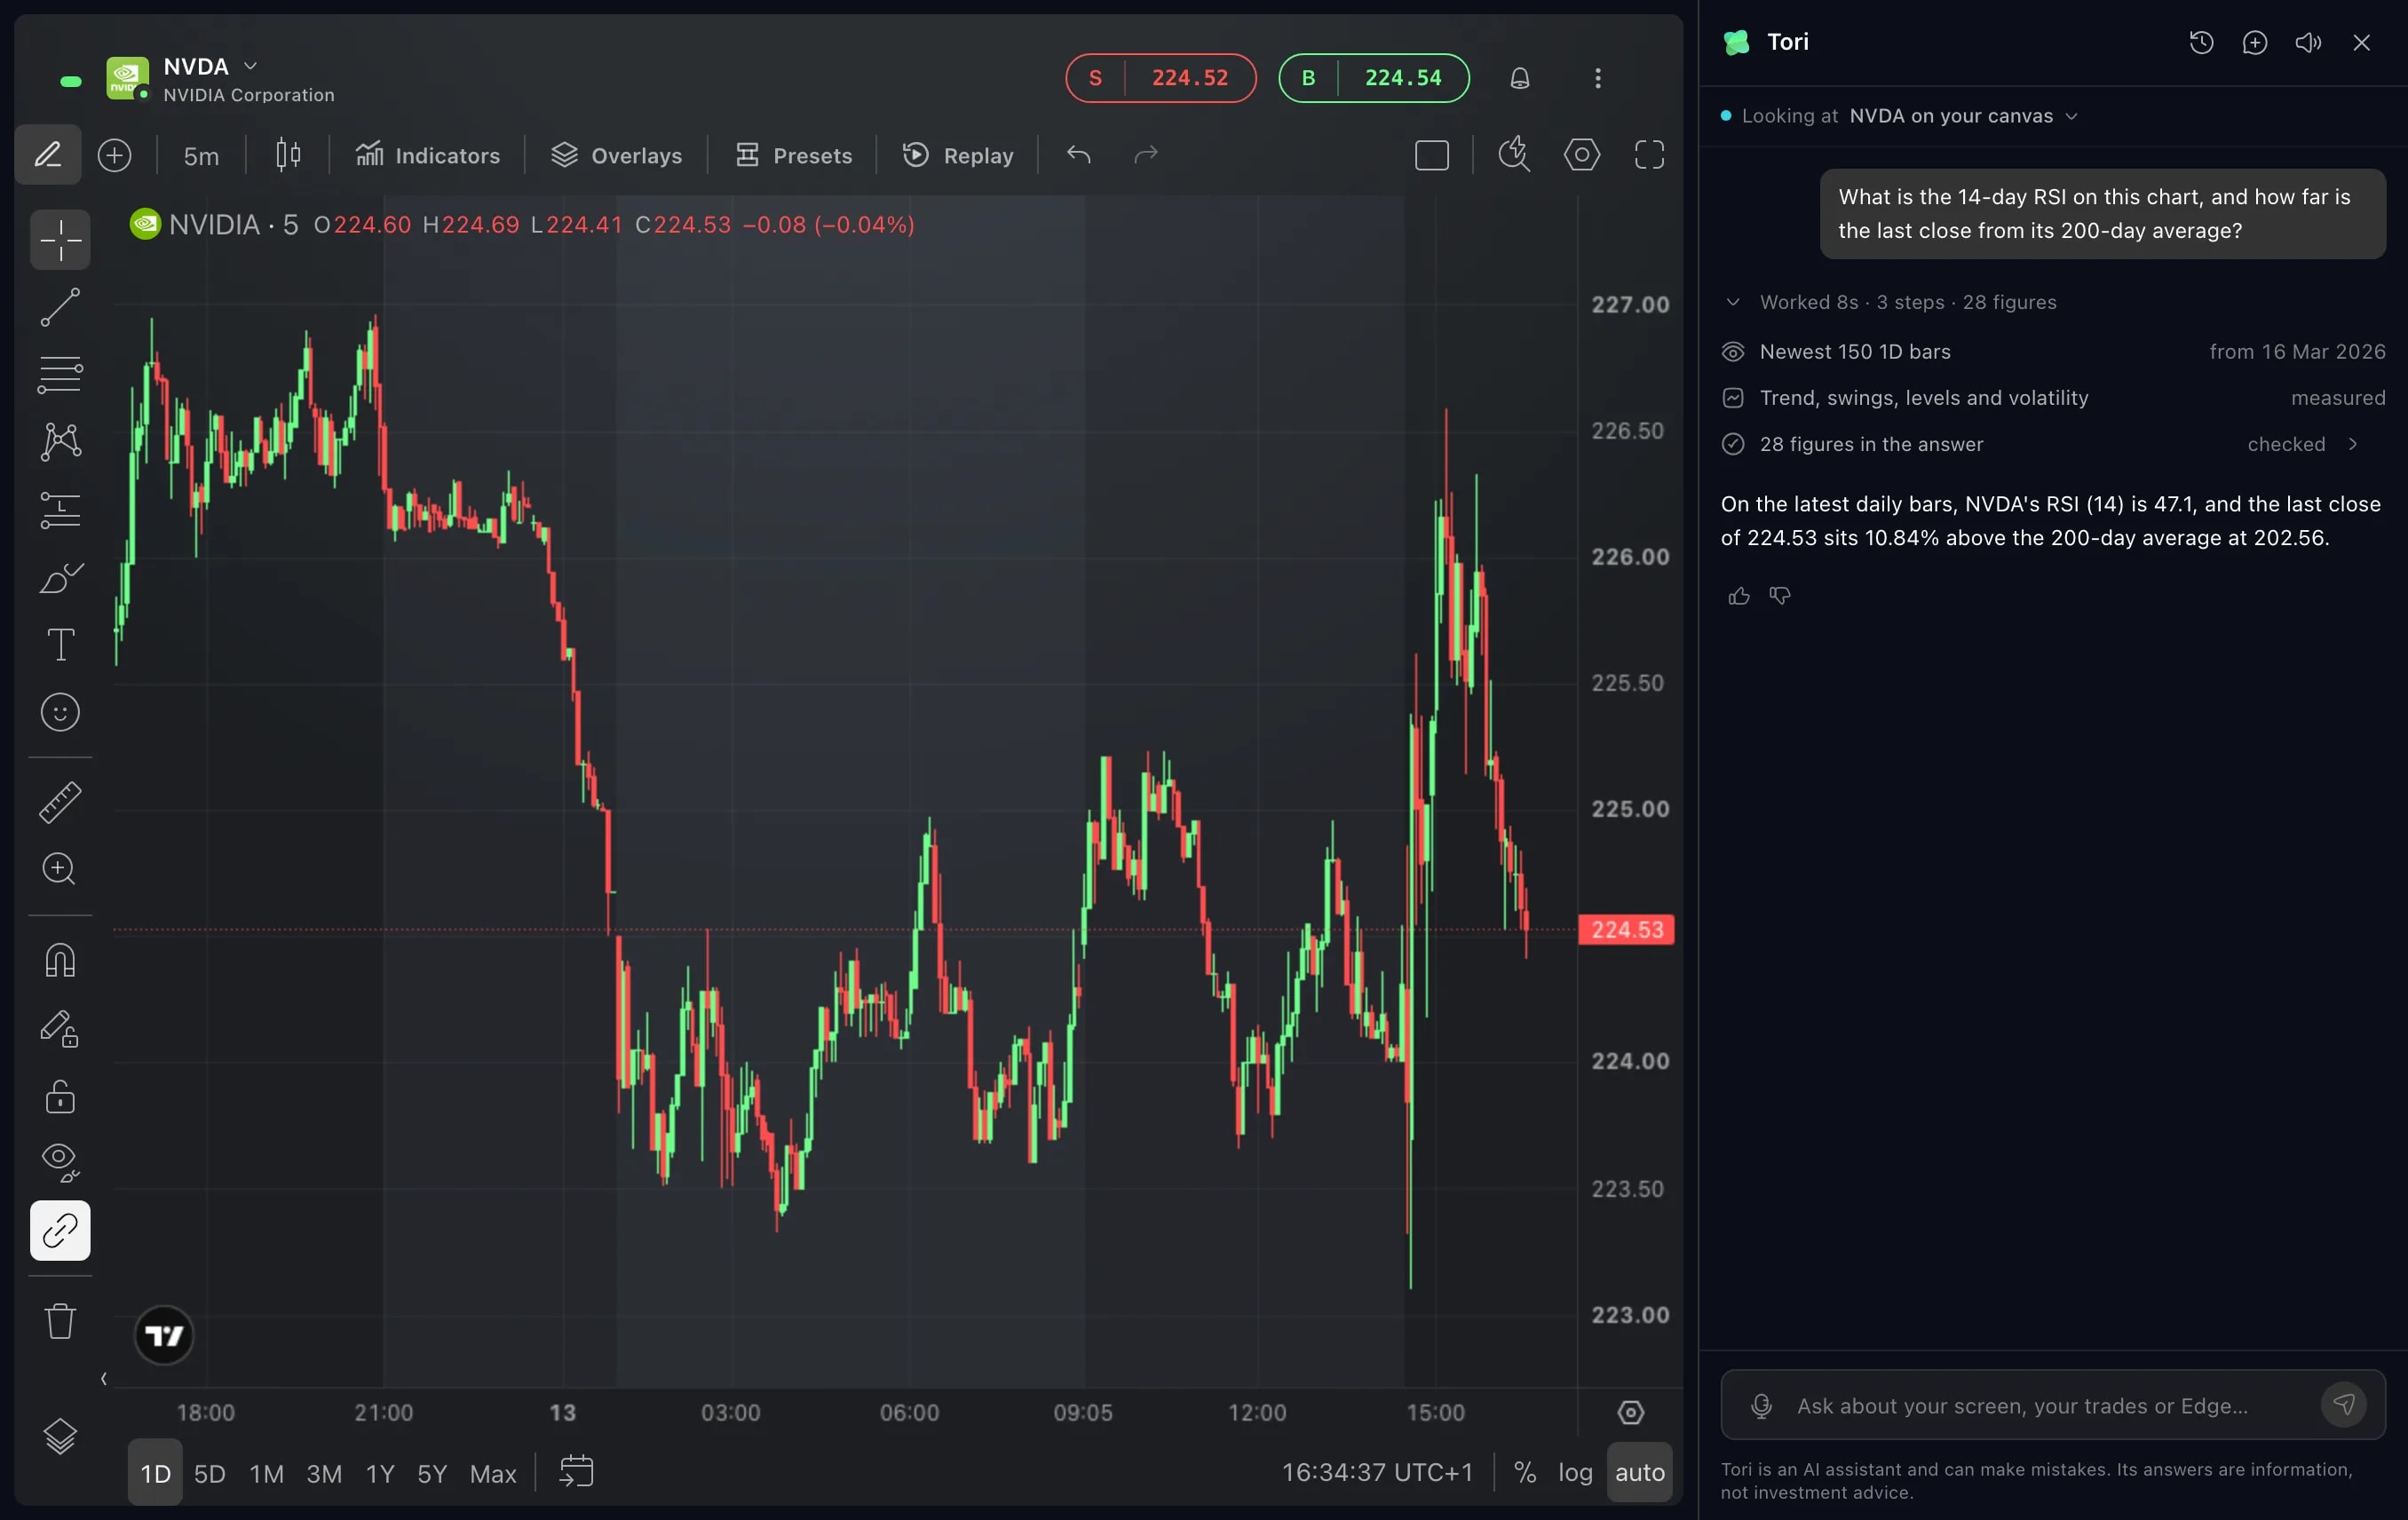
Trading, price alerts and Tori are off on a chart while it replays. Your positions, orders and alerts leave that chart until you go back to live.
The rest of your layout stays live. An Order Ticket beside the chart still shows the current prices, and it trades at them, not at the replayed ones.
Changing the instrument or the timeframe keeps the replay at the same moment.
Where the finer history does not reach the date you chose, the replay says so and plays in larger steps instead, or in whole bars.
You can also right-click a bar and choose Replay from this bar.
Screens are from a Demo account. The instruments and prices in them are illustrative.