Research
Analyst targets, beside your stocks
Add analyst columns to Watchlists, the Screener, Positions and My Portfolio: the consensus, how many analysts rate a stock, the average 12-month target and its upside.
What it is
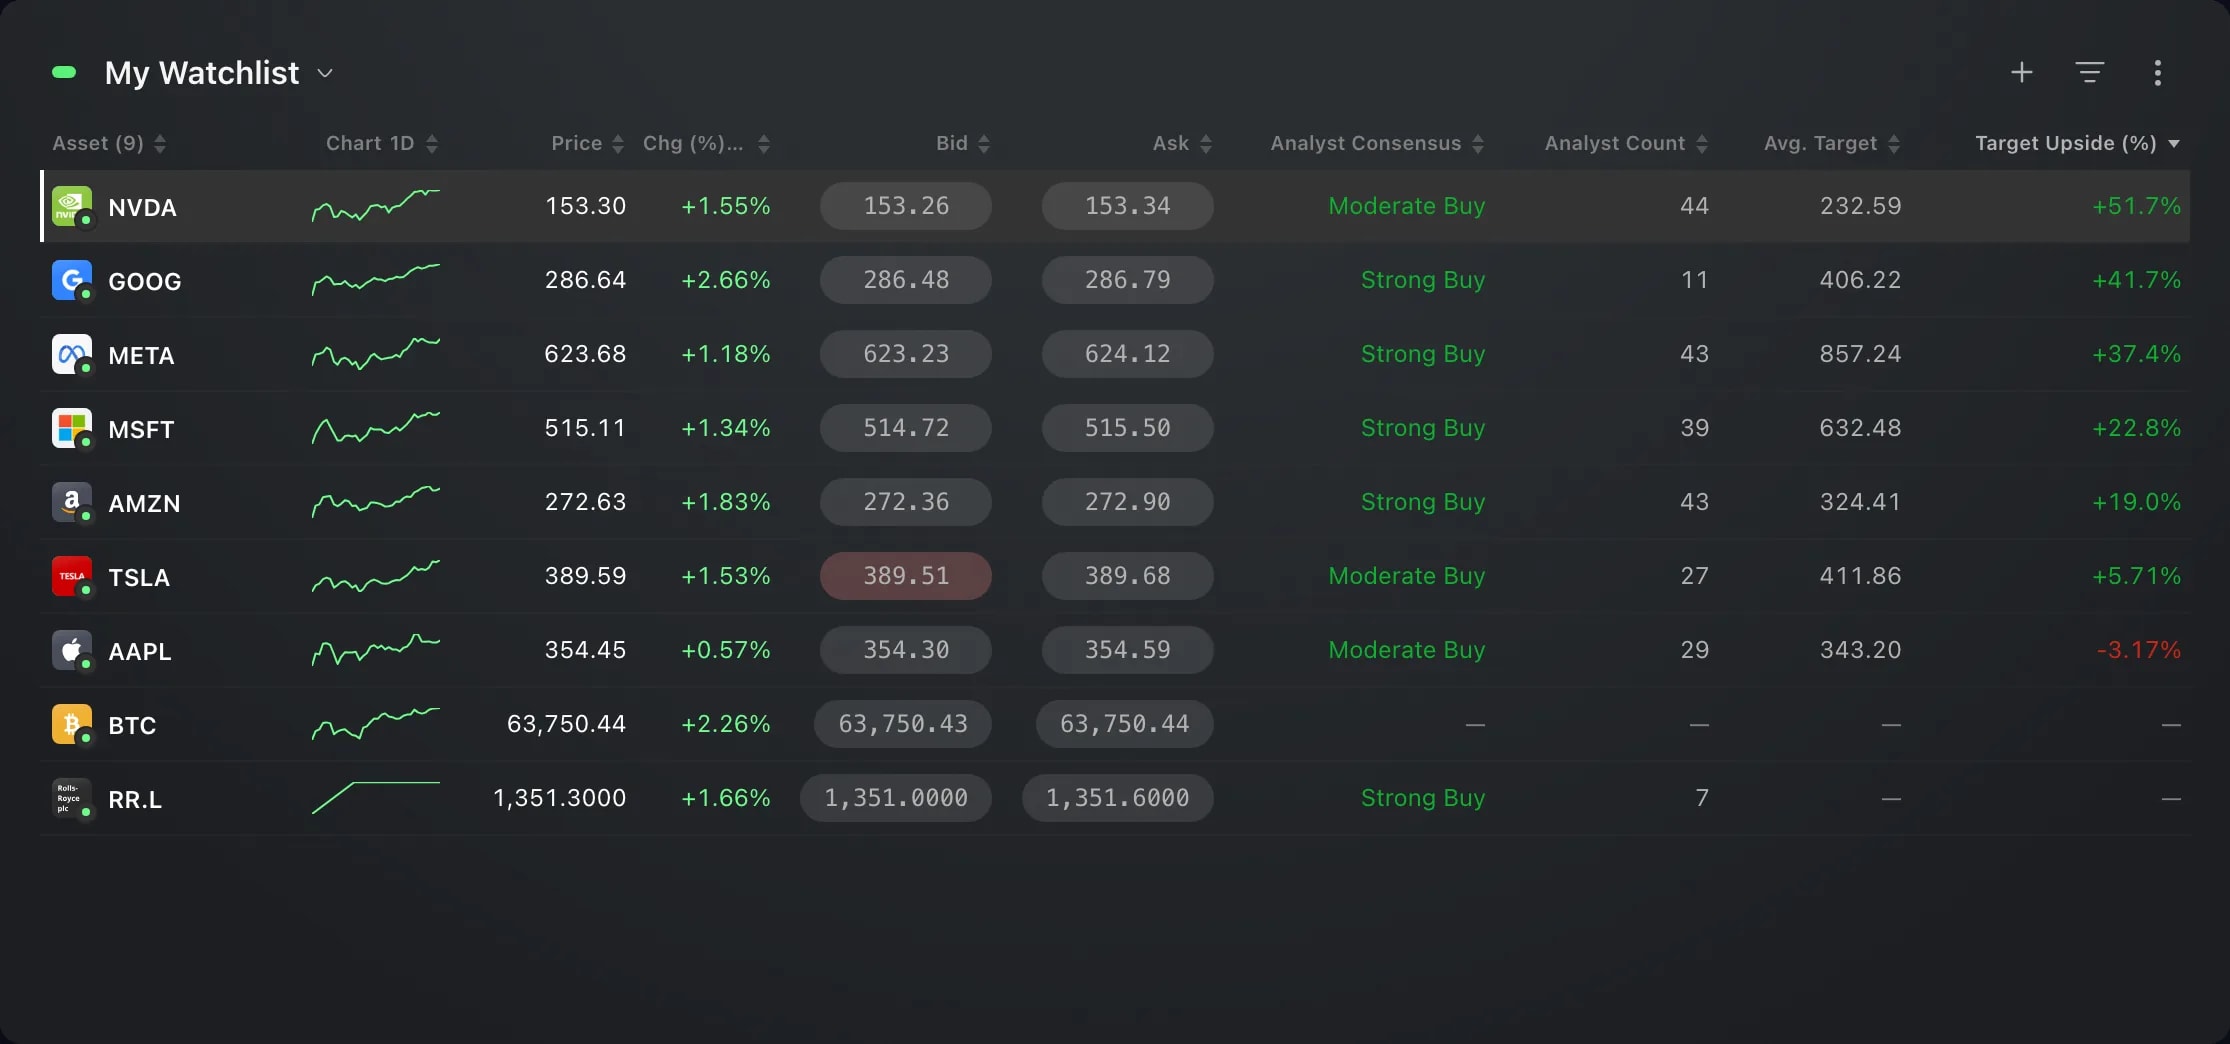
Analyst columns put what analysts say about a stock beside every row of a table, in Watchlists, the Screener, Positions and My Portfolio. Analyst Consensus runs from Strong Sell to Strong Buy, Analyst Count is how many analysts rate the stock, Avg. Target is their average 12-month price target, and Target Upside (%) is how far that target is from the live price.
Reach for them to read a whole list at once instead of opening one stock after another: sort a watchlist by its upside, or keep the consensus beside the stocks you hold. The figures are the opinions of analysts, not a forecast by etoro.
How to use it
In a Watchlists widget at least three tiles wide, open the three-dot menu at the top right and choose Columns….
Scroll to the Analysts group and choose the columns you want: Analyst Consensus, Analyst Count, Avg. Target and Target Upside (%). Each one joins the end of the table and the list under Active columns, where you can drag it to another place.
Close the panel. Each stock and ETF row now shows its figures. Hover a column header for what they count: ratings and 12-month price targets issued in the last three months.
Click a column header to sort by it: lowest first, then highest first, then back to the list’s own order. Analyst Consensus sorts along its scale, from Strong Sell to Strong Buy, and rows without a figure stay at the bottom.
In the Screener, Columns is the grid icon at the top of the widget, or in its three-dot menu when the widget is narrow. It offers the same Analysts group, and its Filters, under Valuation, also narrow a screen by Analyst Consensus, Analyst Count and Target Upside (%).
In My Portfolio, select Positions, open the three-dot menu and choose Columns…. The Positions widget has Columns… in its three-dot menu too. Both offer the Analysts group, so each stock and ETF you hold shows its figures.
Good to know
Only stocks and ETFs have analyst figures. Other rows, such as a cryptocurrency, show a dash, and so does a stock no analyst rated in the last three months. An ETF’s figures come from the ratings of the stocks it holds, weighted by their share of the fund.
Targets and upside are shown for instruments quoted in US dollars. A stock listed elsewhere, such as in London or Hong Kong, shows its consensus and count, and its target cells say why they are empty when you hover them.
Target Upside (%) follows the live price, so it changes while the market trades.
Low Target and High Target, the lowest and highest 12-month targets, are part of etoro Club’s research tools. Without them, the panel lists the two under Only with etoro Club, and they can’t be added.
Analyst Count, Avg. Target and Target Upside (%) can also go into a formula column of your own, from Insert a field….
If the figures can't be read for a while, the cells show a dash, and hovering a column header says they are unavailable right now.
Screens are from a Demo account. The instruments and prices in them are illustrative.